Figure 3.
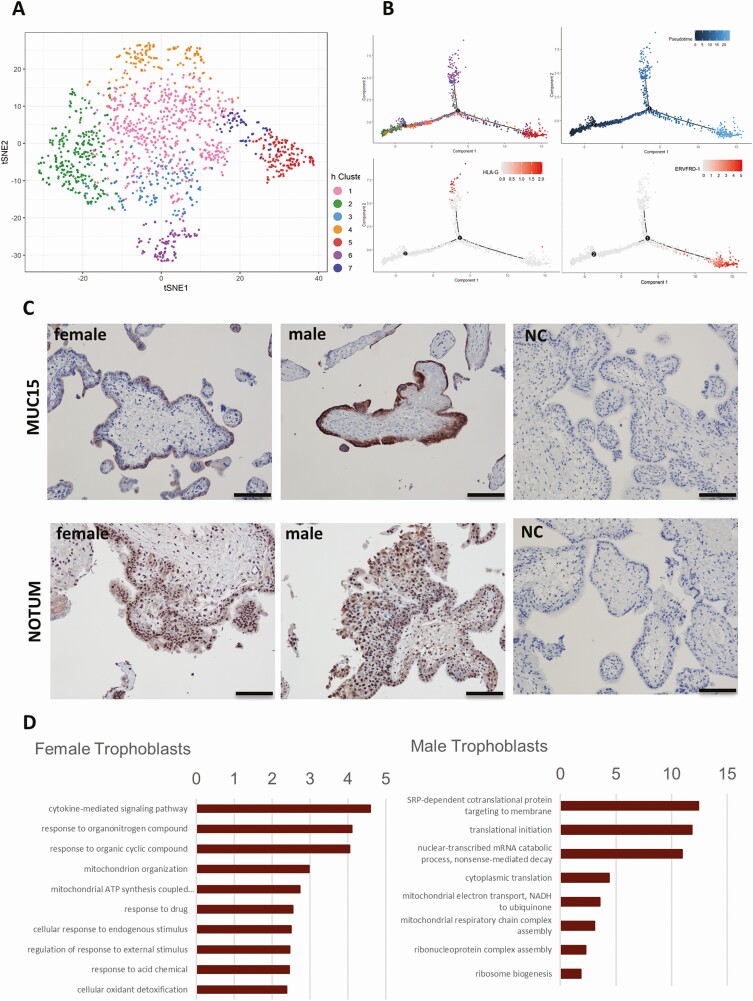
Sexual dimorphism in the first trimester trophoblasts. (A) tSNE of trophoblast subclusters using scran and scater packages. Colors indicate subclusters within the trophoblast population. (B) Pseudotime reconstruction of the developmental trajectory in the trophoblast population shows trophoblast subclusters (T1~T7), indicated by colors. The timepoints 1 and 2 represent hierarchical branching events. Pseudotemporal trajectory indicates developmental timeline. The distribution patterns of cells expressing EVT marker gene HLA-G and STB marker gene ERVFRD-1 in the pseudotemporal trajectory. (C) Representative images of MUC15 and NOTUM immunostaining in 3 female placentas and 4 male placentas, bar = 100 um. (D) The top 10 enriched GO terms are presented as −log10(P value) for either sex in trophoblasts. (Bonferroni-corrected for P < 0.05).

