Figure 2.
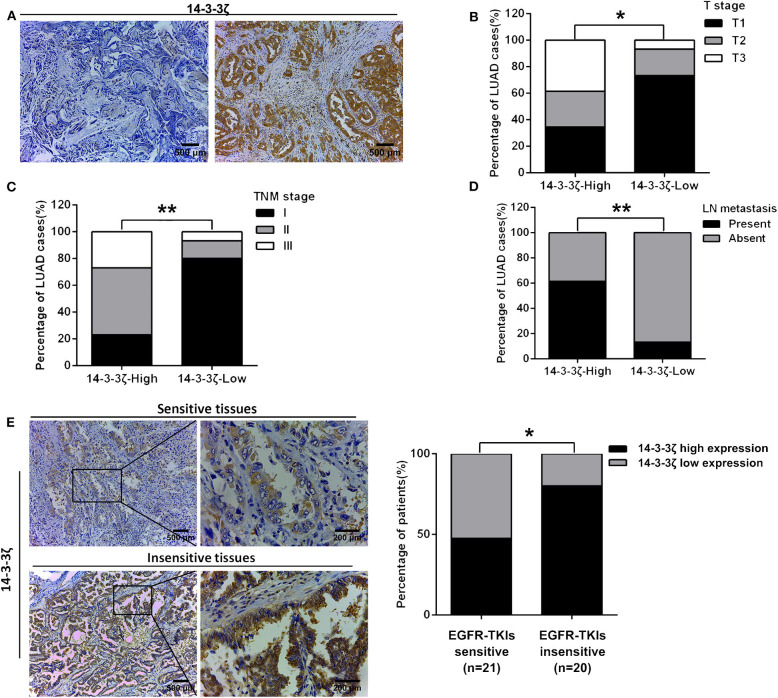
The clinicopathological signature of 14-3-3ζ in LUAD tissues with EGFR-activating mutations. (A) Representative immunohistochemistry (IHC) staining images of low expression (left) and high expression (right) of 14-3-3ζ in LUAD tissues. Magnification, ×100; Scale bar = 500 μm. (B–D) The protein expression level of 14-3-3ζ was classified as low or high based on the intensity and proportion of positively stained cells in these specimens. The percentages of patients with different T stages (B), different TNM stages (C), with and without lymph node metastasis, and (D) were assigned according to the expression level of 14-3-3ζ. (E) Representative immunostaining profiles of 14-3-3ζ in drug-sensitive (PFS ≥ 6 months, n = 21) and drug-insensitive (PFS < 6 months, n = 20) LUAD tissues. Magnification, ×100; Scale bar = 500 μm. Magnification, ×400; Scale bar = 200 μm (left). The percentages of patients with high expression (black bar) and low expression of 14-3-3ζ (gray bar) were assigned according to different responses to EGFR-tyrosine kinase inhibitors (TKIs) (right). *p < 0.05, **p < 0.01.

