Figure 3.
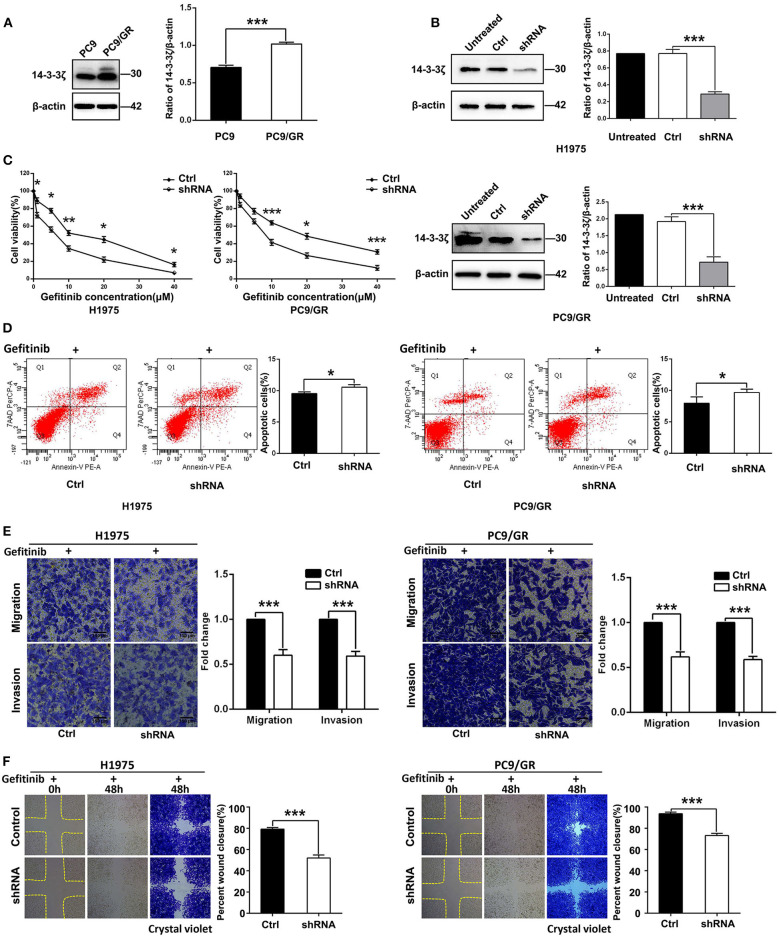
14-3-3ζ knockdown overcomes EGFR-TKI resistance in EGFR-mutant LUAD cells. (A) 14-3-3ζ protein expression levels in PC9 and PC9/GR cell lines, as determined by Western blot analysis. Histogram showing quantification of relative expression levels of 14-3-3ζ. β-actin was used as a loading control. (B) Western blot analyses of 14-3-3ζ protein expression levels in NCI-H1975 and PC9/GR cells and in cells transfected with scrambled-shRNA (Ctrl) or 14-3-3ζ-shRNA (shRNA). (C) H1975/14-3-3ζ-shRNA (left), PC9/GR/14-3-3ζ-shRNA (right), and corresponding vector control cells were treated with the indicated doses of gefitinib for 48 h, and cell viability was analyzed by a Cell Counting Kit-8 (CCK-8) assay. (D) Flow cytometric analysis of apoptosis in the indicated cells treated with gefitinib were assessed by Annexin V and 7-amino-actinomycin (7-AAD) staining. A representative flow profile is shown (left), and a summary of the percentage of Annexin V-positive cells is shown (right). (E) Transwell assays were conducted to assess EGFR-TKI-resistant cell migration and invasion after 14-3-3ζ knockdown in cells cultured in the presence of gefitinib compared with those of corresponding vector control cells (i.e., crystal violet staining of migratory and invasive cells). Original magnification, ×100; Scale bar 150 μm. (F) A wound healing assay was performed in the indicated cells as described in (E). Original magnification, ×100. *p < 0.05, **p < 0.01, ***p < 0.001.

