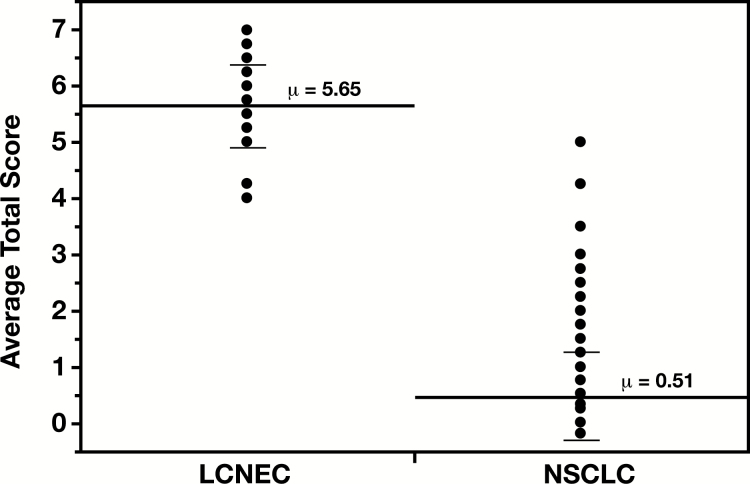
Figure 1.
Average total scores in large cell neuroendocrine carcinoma (LCNEC) and non-small cell lung carcinoma (NSCLC). Each dot represents an individual case but cases with overlapping total scores (average from four pathologists) are displayed as a single dot. The mean total scores (long solid lines) with the corresponding values (μ) and the standard deviations (short solid lines) for each phenotypic category are displayed on the graph. The mean total score for LCNEC (5.65) was significantly higher than that for NSCLC (0.51, P < .0001).

