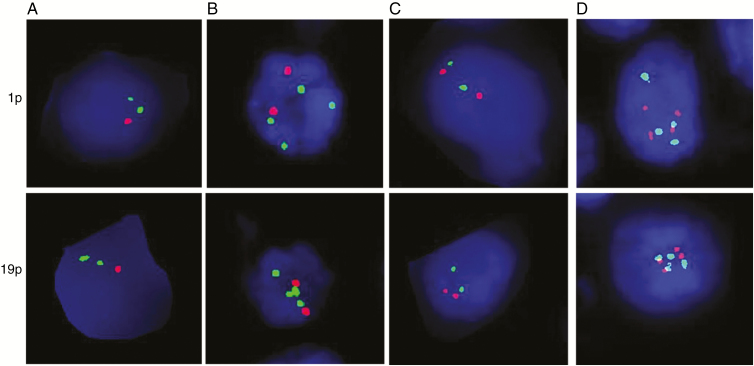
Fig. 1.
Representative FISH images illustrate the presence and absence of polysomy. (A) 1p and 19q loss without polysomy, (B) 1p and 19q relative loss with concurrent polysomy, (C) 1p and 19q maintenance without polysomy, and (D) 1p and 19q maintenance with polysomy. Red probe is for 1p or 19q; green probe is for 1q or 19p.

