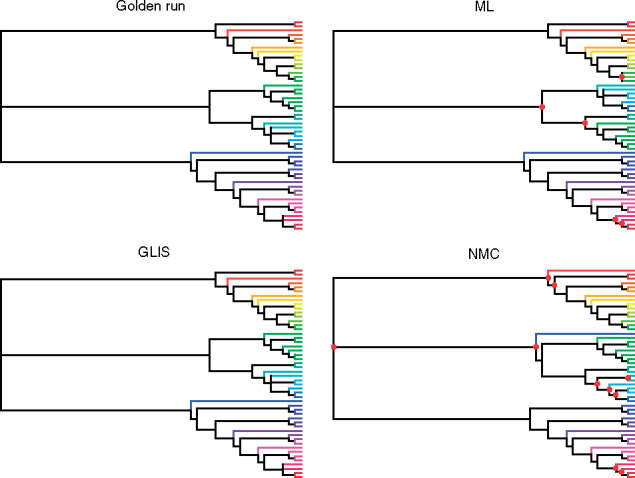
Figure 5.

Majority rule consensus trees DS5 based on four sources for posterior probabilities of trees. Each taxon is assigned a unique color and the branch leading to that taxon is colored the same in all four trees to show differences. The golden run and GLIS trees are identical, while the tree for ML has a Robinson–Foulds distance of four to those trees and the tree for NMC a distance 14 (and 10 from the ML tree). Nodes with red circles denote parts of the tree different from the golden run tree.
