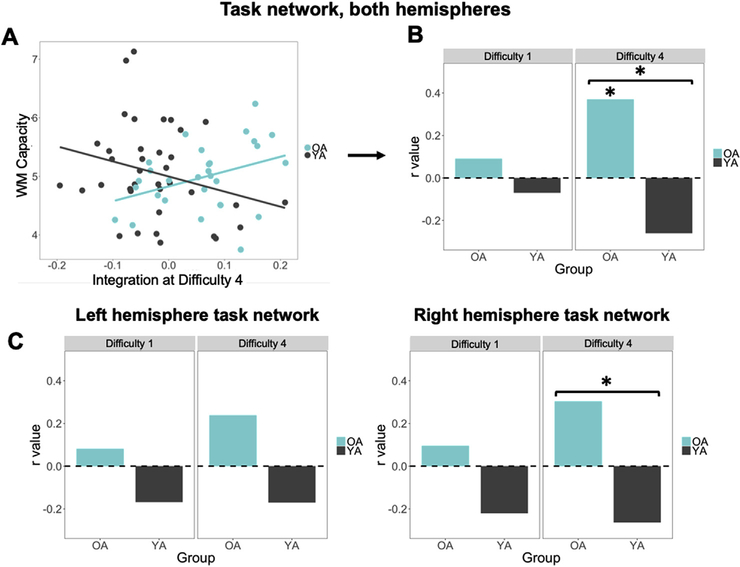
Fig. 6.
Relationship of task-network integration and WM capacity (p < 0.05 = *, p < 0.01 = **). (A) Task-network integration in the most difficult task condition positively correlates with individual WM capacity scores in older adults. (B) r values of these correlations are significant for older adults with a significant difference across group only in the high difficulty level. (C) Split by hemisphere, the difference in correlation values is significant only for the Right hemisphere in the high difficulty level.

