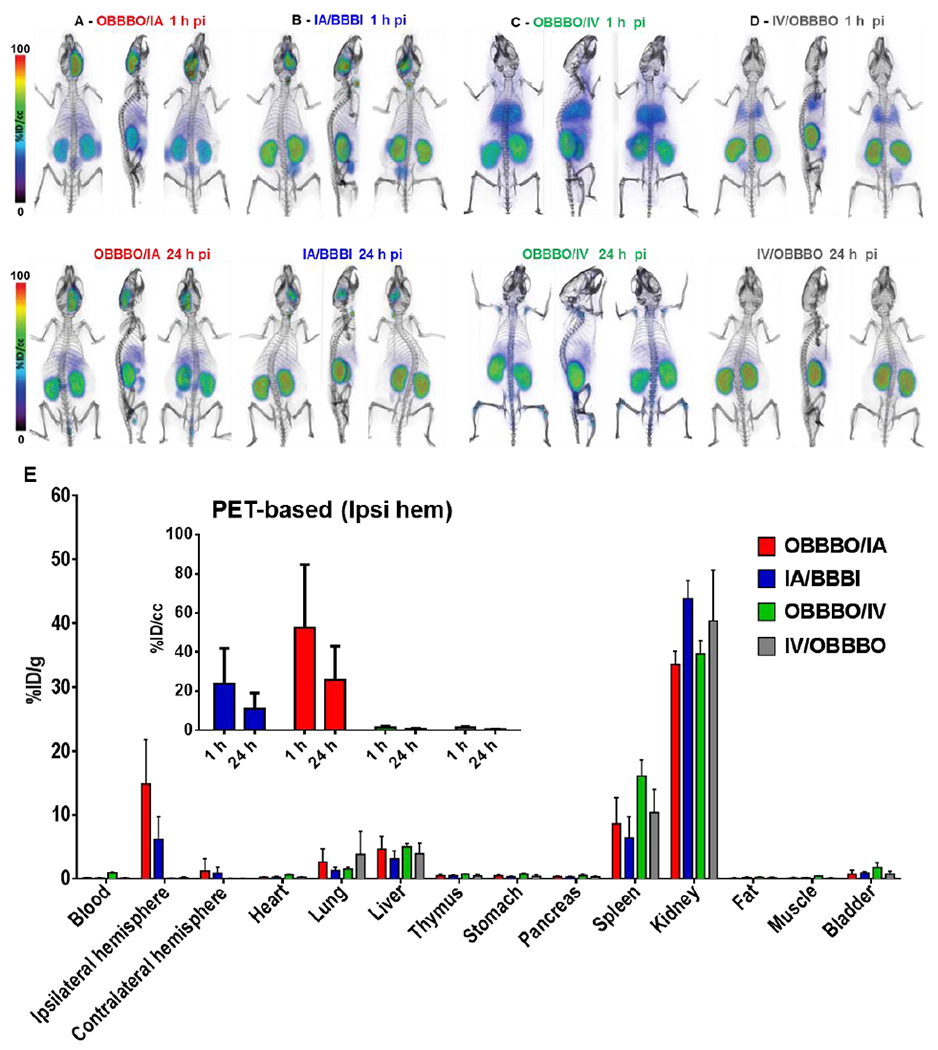
Fig 3.

PET-CT imaging and ex vivo biodistribution of 89ZrNB(DFO)2 at 24 h after infusion. Whole body volume rendered PET-CT images recorded 1 h and 24 h post infusion of ~8.5 MBq (~230 μCi) of 89ZrNB(DFO)2, demonstrating its biodistribution upon: A - OBBBO followed by immediate IA infusion, B - IA infusion with BBBI, C - OBBBO followed by immediate IV infusion and D - IV infusion followed by OBBBO 5 min after infusion was completed. E - Ex vivo biodistribution of 89ZrNB(DFO)2 at 24 h after infusion in the same groups (insert - PET-based quantification of 89ZrNB(DFO)2 uptake in ipsilateral hemisphere), showing in agreement with PET imaging higher uptake of 89ZrNB(DFO)2 in ipsilateral hemisphere compared to contralateral hemisphere in OBBBO/IA group and its higher brain accumulation in comparison with IA/OBBBI, OBBBO/IV and IV/OBBBO cohorts
