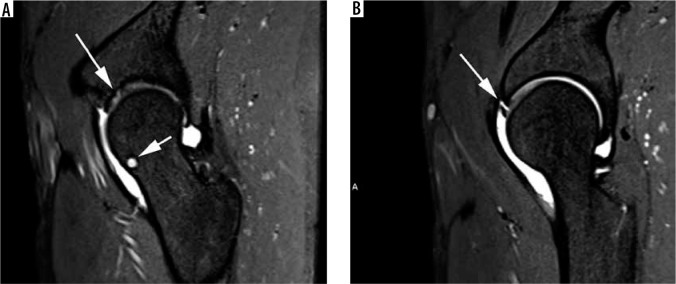
Figure 15.
Articular cartilage loss, herniation pit and chondrolabral separation on sagittal T1W fat-saturated magnetic resonance arthrogram images. A) Note partial-thickness articular cartilage loss at the acetabular margin (long arrow) and a synovial herniation pit (short arrow). B) There is an intersub- stance anterior chondrolabral junction tear (arrow)

