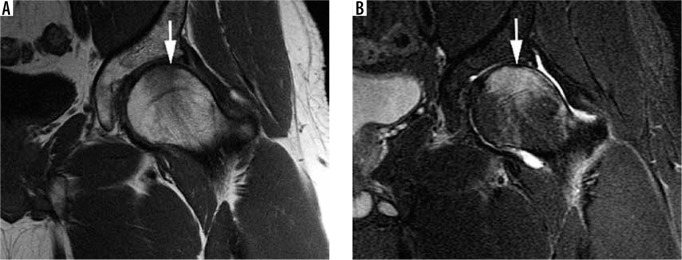
Figure 7.
Subchondral insufficiency fracture of the left femoral head. A) Coronal T1W magnetic resonance (MR) image demonstrating a band of subchondral low signal intensity in the weight-bearing portion of the femoral head consistent with a fracture line (arrow). B) Coronal short-tau inversion recovery MR image demonstrating subchondral low signal condensation/fracture line (arrow) with surrounding high signal intensity bone marrow oedema

