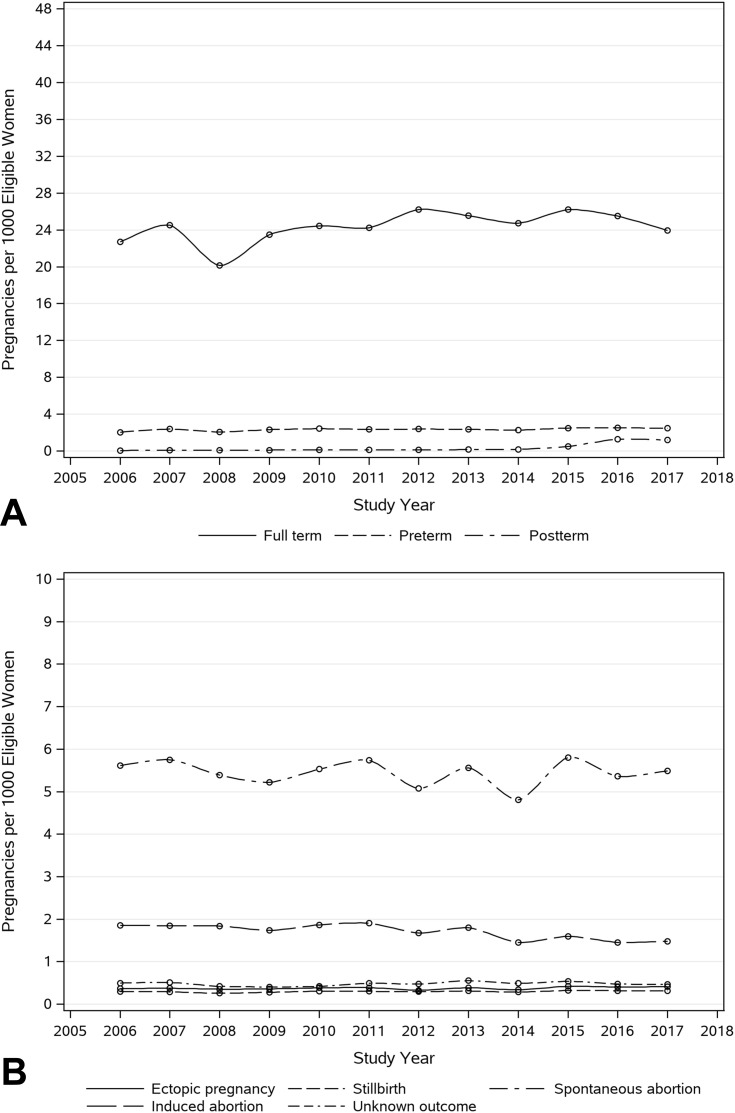
Figure 1.
Secular trend of pregnancies among women of child-bearing age stratified by live, mixed, and unclassified deliveries (A) and non-live outcomes (B).
Notes: The numerator is the total number of pregnancy episodes identified by the algorithm, which had 45 weeks of continuous health plan enrollment after the estimated LMP date. The denominator includes all women aged 12–55 years with at least 45 weeks of health plan enrollment in each respective study year. Pregnancy episodes were anchored in the calendar year of their endpoint date.

