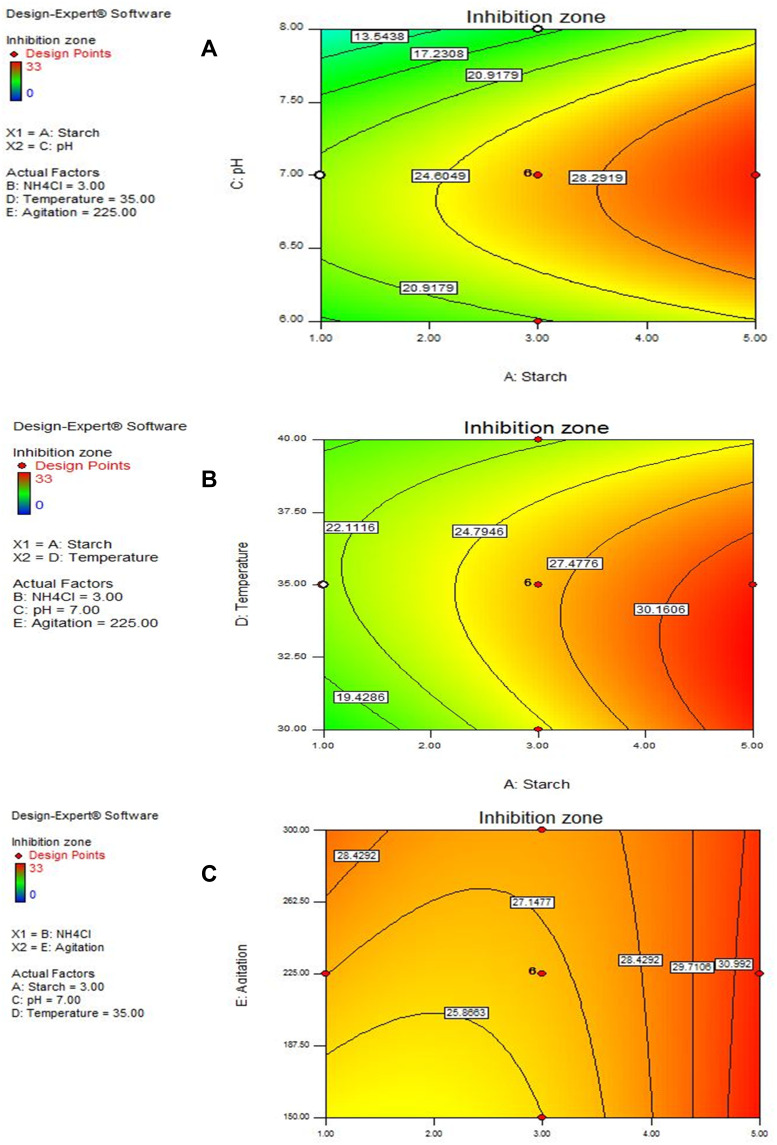
Figure 5.
Contour plots representing the effect of the five significant parameters on inhibition zone obtained by the metabolite of Lysinibacillus isolate MK212927. When the effect of two parameters was plotted, the remaining ones were set at central level (A) starch and pH (B) starch and temperature (C) NH4Cl and agitation.

