. 2020 Oct 19;128(10):107006. doi: 10.1289/EHP6920

Figure 1.

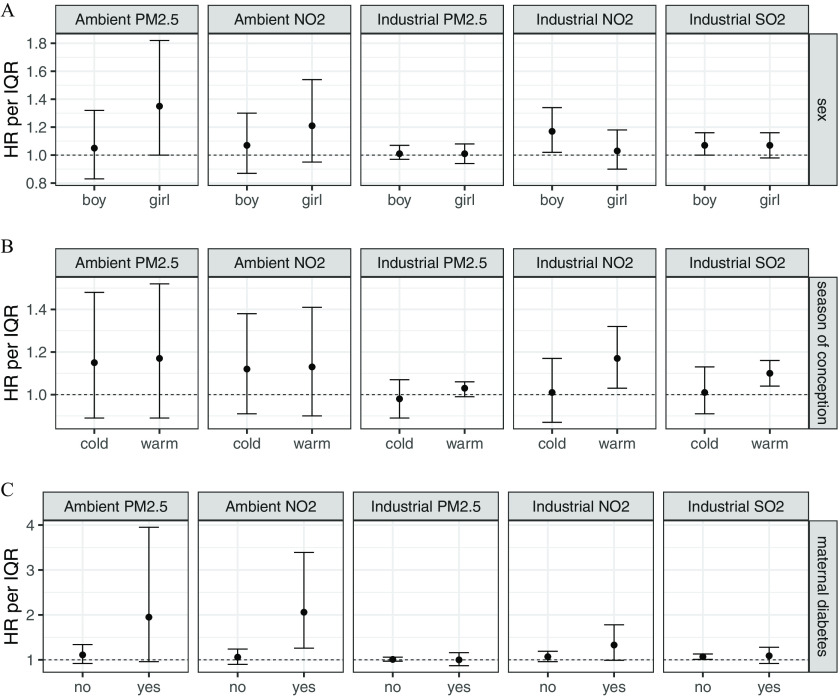
Figures 1A, 1B, and 1C are three sets of five graphs. The first five graphs (Figure 1A) titled Ambient fine particulate matter, Ambient nitrogen dioxide, Industrial fine particulate matter, Industrial nitrogen dioxide, and Industrial Sulfur dioxide depict adjusted hazard ratio between prenatal exposure to ambient and industrial air pollution and incidence of childhood Kawasaki disease by plotting hazard ratio per interquartile range, ranging from 0.8 to 1.8 in increments of 0.2 (left y-axis) and sex (right y-axis) across boy and girl (x-axis), respectively. The next five graphs (Figure 1B) titled Ambient fine particulate matter, Ambient nitrogen dioxide, Industrial fine particulate matter, Industrial nitrogen dioxide, and Industrial Sulfur dioxide depict adjusted hazard ratio between prenatal exposure to ambient and industrial air pollution and incidence of childhood Kawasaki disease by plotting hazard ratio per interquartile range, ranging from 1.0 to 1.4 in increments of 0.2 (left y-axis) and season of conception (right y-axis) across cold and warm (x-axis), respectively. The last five graphs (Figure 1C) titled Ambient fine particulate matter, Ambient nitrogen dioxide, Industrial fine particulate matter, Industrial nitrogen dioxide, and Industrial Sulfur dioxide depicts adjusted hazard ratio between prenatal exposure to ambient and industrial air pollution and incidence of childhood Kawasaki disease by plotting hazard ratio per interquartile range, ranging from 1 to 4 in unit increments (left y-axis) and maternal diabetes (right y-axis) across no and yes (x-axis), respectively.

Adjusted hazard ratio (HR) between prenatal exposure to ambient and industrial air pollution and incidence of childhood Kawasaki disease, according to (A) child sex, (B) season of conception, and (C) maternal diabetes. Dots represent the mean HR for an interquartile (IQR) increment in air pollutant exposure, and bars represent 95% confidence intervals (CIs), estimated separately for each subgroup using single-pollutant Cox models adjusted for maternal age, parity, sex, multiple birth, maternal smoking during pregnancy, material deprivation, birth year, and rural/urban residence. The horizontal axis indicates binary categories for sex (girl/boy), season of conception (cold/warm), and maternal diabetes (no/yes). IQRs are 0.13μg/m3 for industrial fine particulate matter (PM2.5), 1.1μg/m3 for industrial nitrogen dioxide (NO2), 1.7μg/m3 for industrial sulfur dioxide (SO2), 3.8μg/m3 for ambient PM2.5, and 11.9μg/m3 for ambient NO2. Numeric values for HRs and 95% CIs, as well as number of cases in each subgroup and p-value of Cochran Q tests, are provided in Table S4.