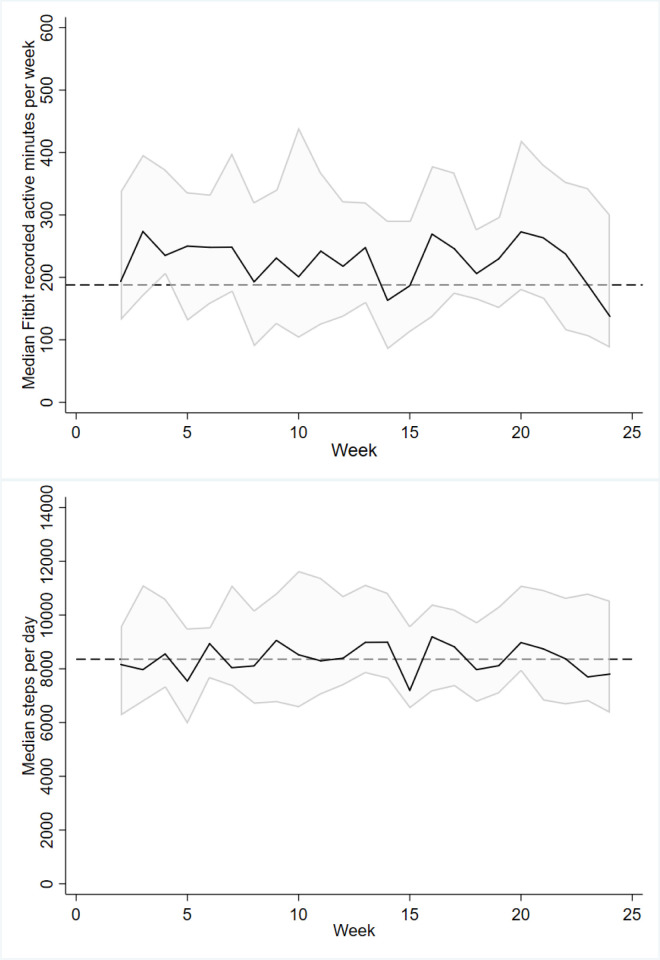
Fig 3. Fitbit median steps per-day per-week and median active minutes per-week across the trial.
The shaded error represents the interquartile range around the median (thick black line). The dotted line represents the median steps per day and median active minutes for the duration of the study, respectively.

