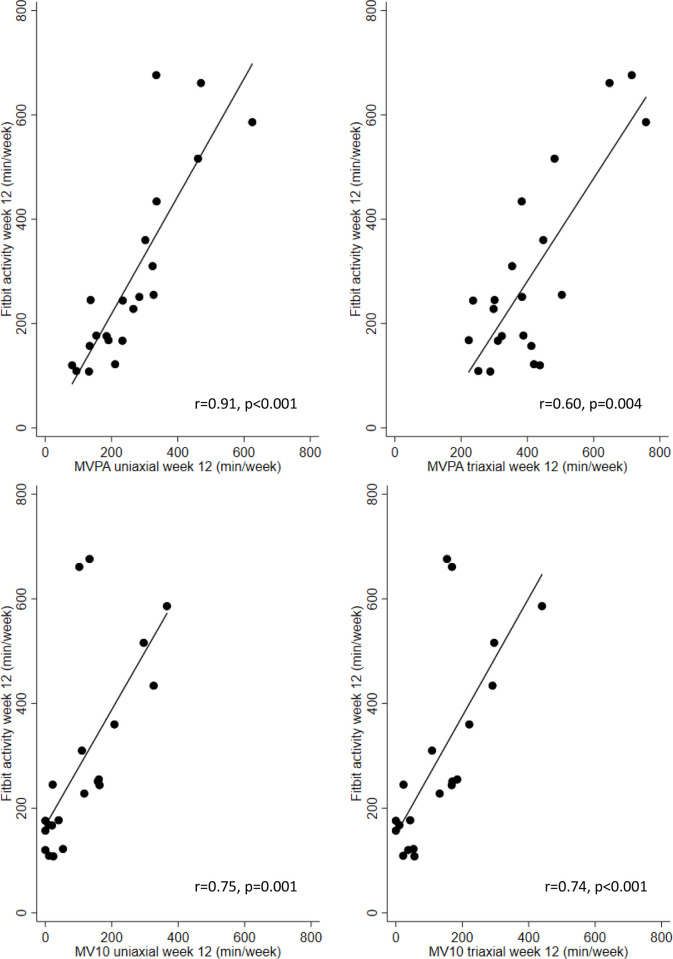
Fig 4. Association between Fitbit active minutes and Actigraph derived moderate-to-vigorous physical activity.
Scatter plots for Fitbit and Actigraph Moderate-to-Vigorous Physical Activity (MVPA) (top) and Fitbit and Actigraph MVPA performed in ≥10-minute bouts (MV10) (bottom) measured activity for uniaxial (left) and triaxial (right) cut points. The diagonal line represents the line of best fit for these data. r is Spearman’s rank order correlation coefficient.

