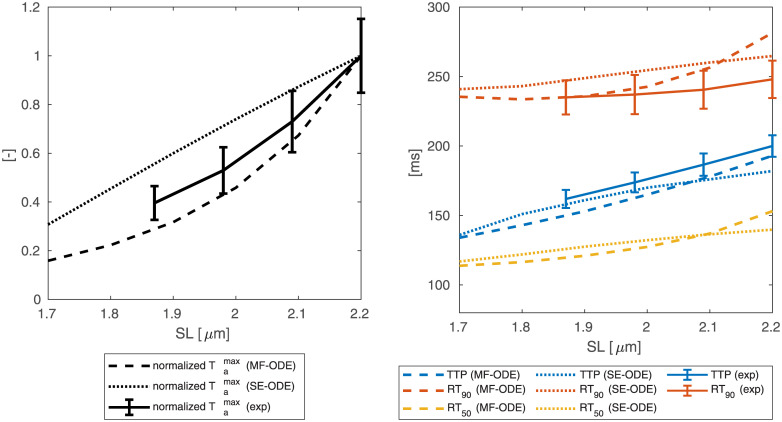
Fig 17. Tension peak, normalized with respect to the value at 2.2 μm (left), and metrics of activation and relaxation kinetics (right) as function of SL during isometric twitches obtained with the SE-ODE and the MF-ODE models for intact, body-temperature human cardiomyocytes.
When possible, model results are compared with experimental data from [95].

