
Figure 2.
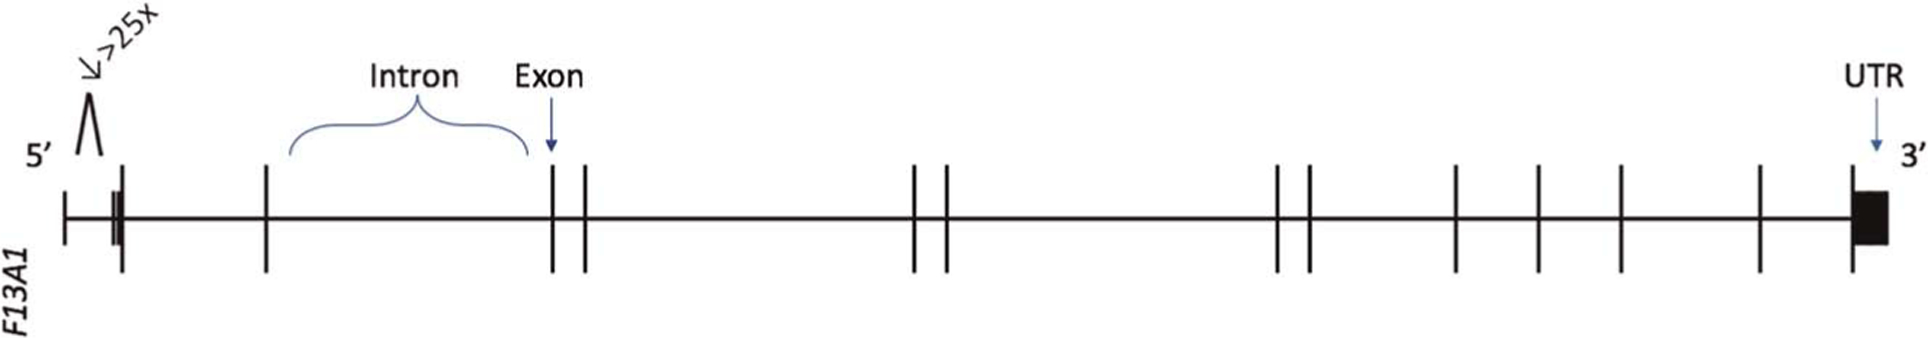
Activated platelet-specific RNA splicing events in isolated severe fTBI visualized using F13A1 gene (encodes Factor XIII Subunit “A”) as a representative example. Differentially discovered splice junctions were used to query the hg19 genome assembly in the University of California at Santa Cruz Genome Browser. Horizontal bars are representing introns and vertical bars are representing exon junctions (not to scale). Numeric decrease (↓) represents the fold change of F13A1 spliced RNA transcript discovered in isolated severe fTBI vs. minimally injured t-control. UTR, untranslated region. 5′ and 3′ ends noted accordingly.