FIGURE 1.

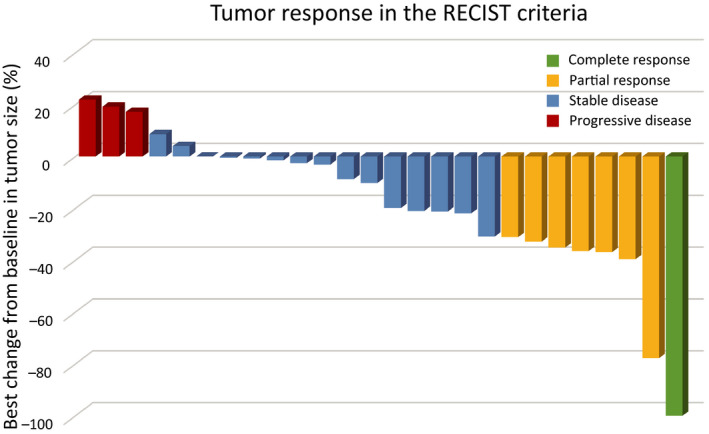
Waterfall plot showing the best response of targeted lesions to S‐1 treatment according to the Response Evaluation Criteria in Solid Tumors

Waterfall plot showing the best response of targeted lesions to S‐1 treatment according to the Response Evaluation Criteria in Solid Tumors