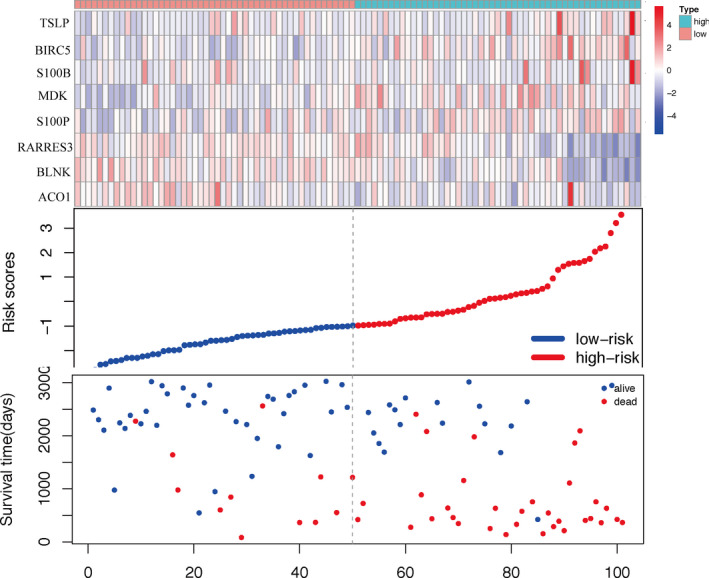
Figure 3.

Analysis of risk score for BC patients in training set, with gene expression profile (top), risk score distribution (middle), and patient survival status (bottom). The black dashed line represents the cut‐off of the risk score, which divides patients into high‐risk and low‐risk groups
