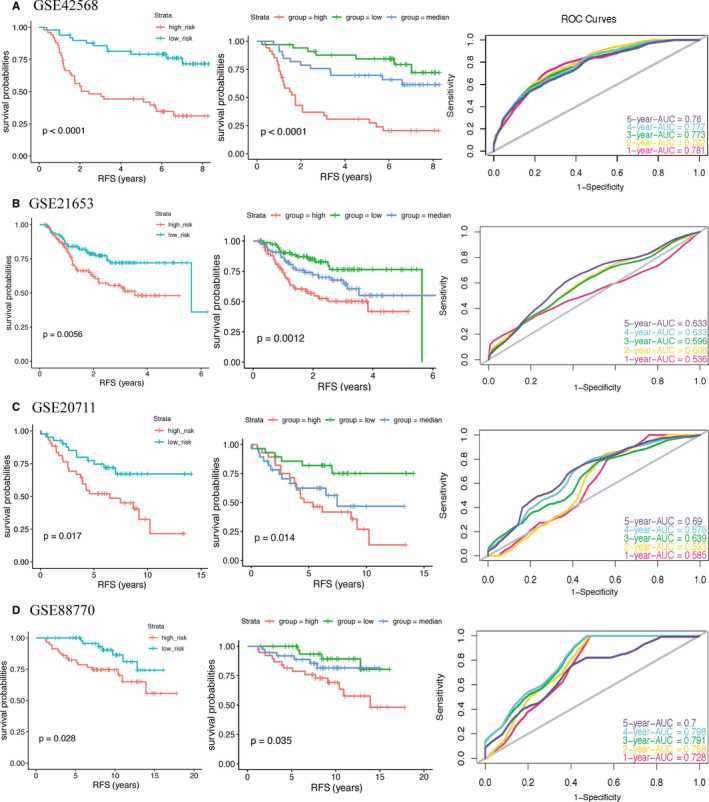
Figure 4.

Kaplan‐Meier survival curve and ROC curves for prognostic signature in training set (A) and validation sets (B‐D). For ROC curves, we set the sensitivity to the ordinate and 1‐specificity to the abscissa. An AUC value close to 1.0 indicates a good diagnosis probability. The RFS of patients in high‐risk group was lower than that in low‐risk group. The ROC curves revealed a fair diagnostic property. P‐value < .05 (log‐rank tests) was considered statistically significant
