
Figure 6.
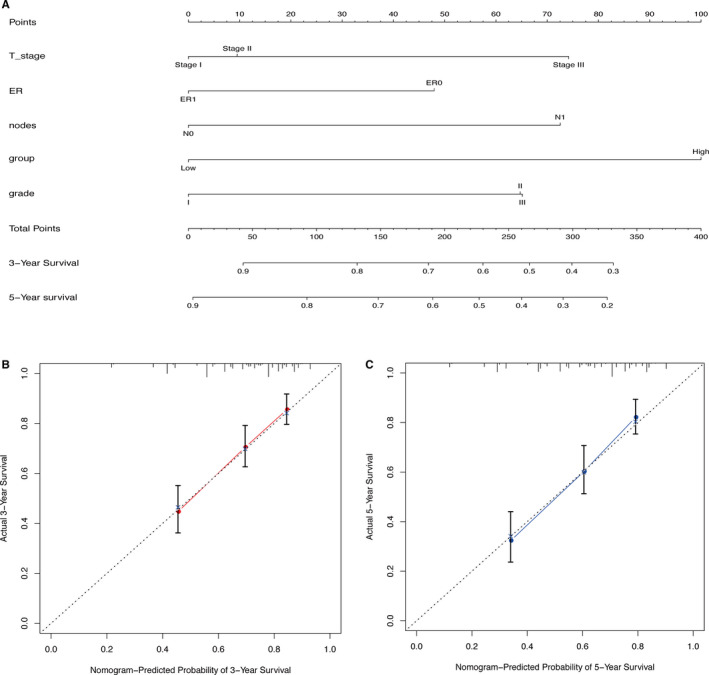
Nomogram constructed to predict the RFS of BC patients. A, BC RFS nomogram. To use the nomogram, each variable axis contains a value that should be matched to the each individual patient with a line upward to determine the number of points received for each variable value. The sum of these numbers is located on the total points axis, and a line should be drawn downward to the survival axis to determine the probability of a release event with three or five years. B‐C, Calibration curve for predicting RFS at 3‐year (B) and 5‐year (C) in all datasets. The nomogram‐predicted probability of RFS is plotted on the x‐axis; actual RFS is plotted on the y‐axis. The calibration curve showed that the nomogram had good prediction accuracy.