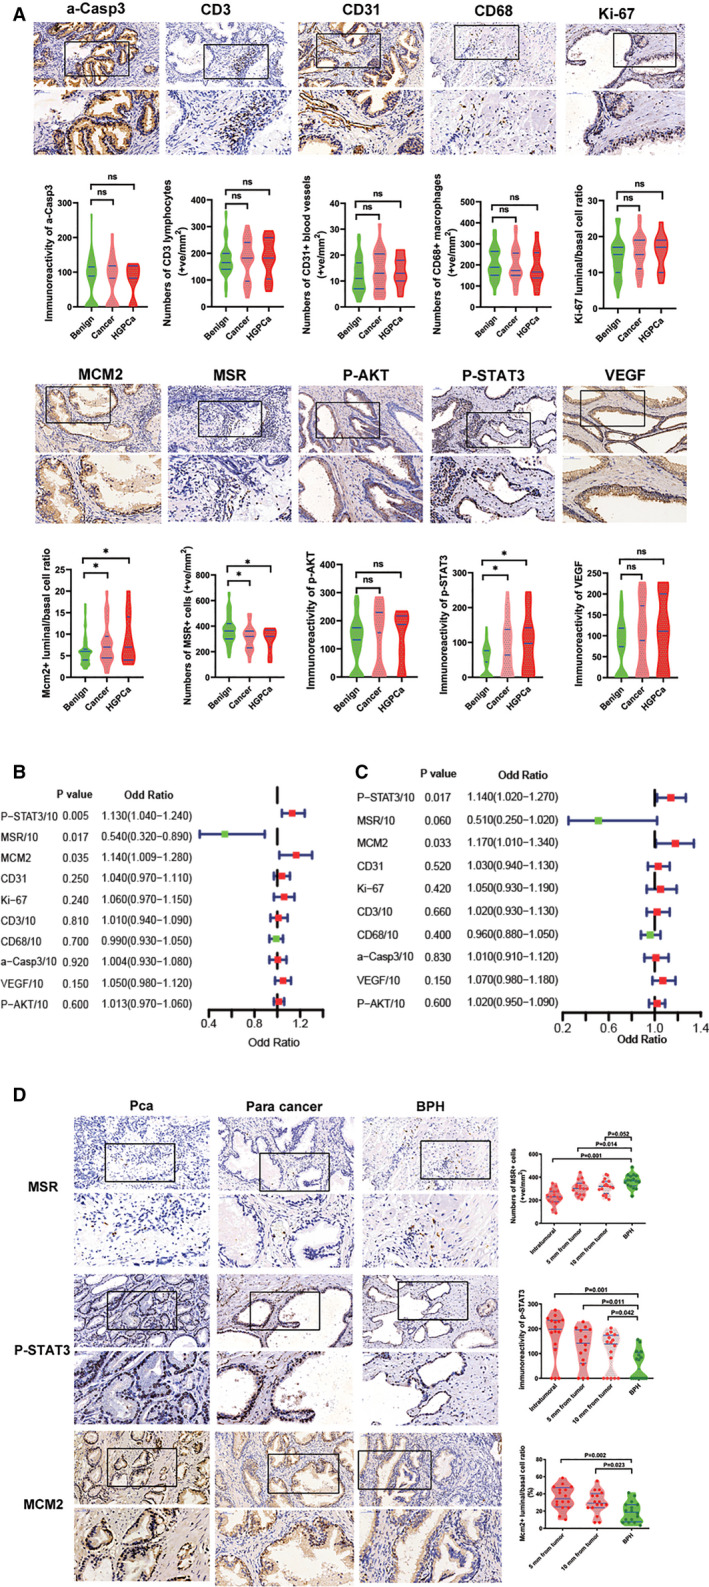
Figure 2.

Screening of biomarkers and construction of biomarker index. (A) Immunoreactivity of biomarkers in initial negative biopsy samples of repeat biopsy cohort (original magnification x 20 and 40). Violin‐plot showed immunoreactivity of biomarkers in initial negative biopsy samples grouped by repeat biopsy result. Blue lines represent the median and the 25th to 75th percentiles. (B, C) Univariate logistic regression analysis of the 10 biomarkers when predicting cancer (B) and HGPCa (C) at repeat biopsy. (D) The immunoreactivity of p‐STAT3, Mcm2 + luminal to basal ratio and number of MSR + cells in PCa, pericancer tissues with different distances from the tumor area and benign prostate tissues (original magnification x 20 and 40). Because the prostate tumor tissues lacked basal cells, we defined the Mcm2 + luminal to basal ratio score in the tumor tissues as positive infinity and did not show it in the violin plot for the PCa group. Violin‐plot on the right showed immunoreactivity of biomarkers. Blue lines represent the median and the 25th to 75th percentiles
