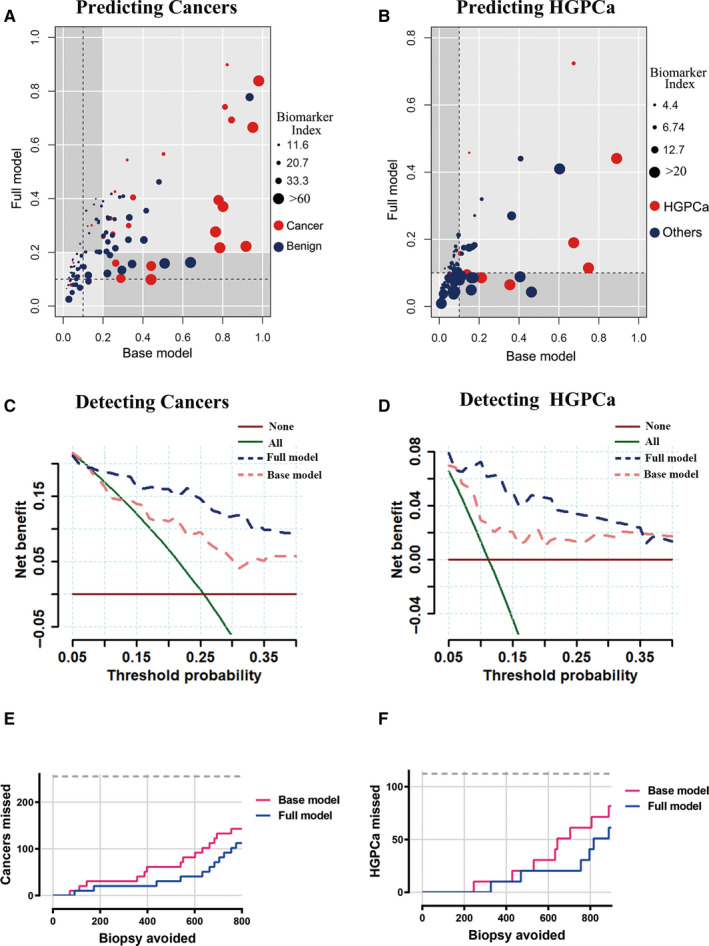
Figure 4.

Role of biomarker index in repeat biopsy decision‐making process. (A, B) Reclassification of base model score categories by biomarker‐clinicopathological classifiers (full model) score for patients in the cohort. Based on LOESS curves of models’ scores, 20 and 11 were selected as threshold value to reclassify patients into high‐risk and low‐risk groups when predicting cancers (A) and HGPCa (B). Individual patients were represented as dots colored by repeat biopsy outcomes; sizes of dots represented the biomarker index as indicated. Gray quadrants represented situations in which the full model classifier reclassifies patients compared to the base model. Patients who did not have cancer or HGPCa (blue dots) in the bottom‐right quadrant and patients who had cancer or HGPCa (red dots) in the top‐left quadrant were reclassified correctly by the full model. (C, D) Decision curves for outcome of cancer (C) and HGPCa (D) using the base model and full model. Strategies for biopsies in all men (biopsy all) or no men (biopsy none) were also shown. The line with the highest net benefit at any particular threshold probability for biopsy (x‐axis) will yield the best clinical results. E, F: Number of biopsies that could be avoided and number of cancers (E) or HGPCa (F) that could be missed per 1000 patients based on prediction models at different predicted probabilities
