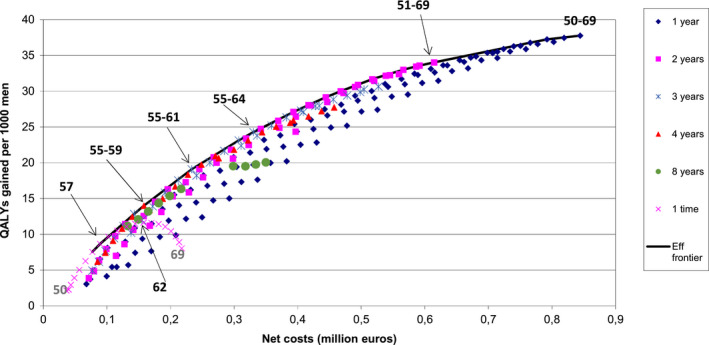
Figure 2.

Net costs and QALYs gained per 1000 men. The start and end age of most optimal strategies given 1, 2, 3, 4, 8, and once depicted in the figure. Numbers in the legend indicate the screening intervals used in the model. Eff frontier, efficient frontier
