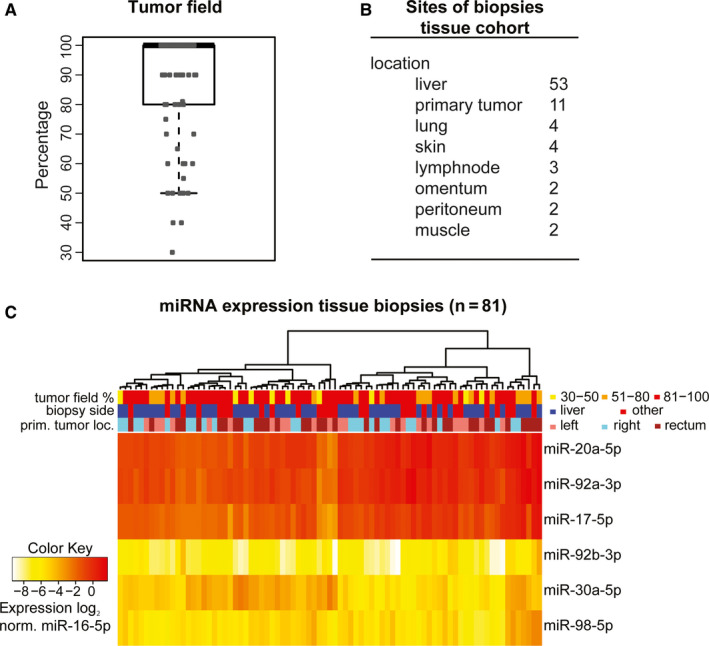
FIGURE 2.

Tumor percentage, sample characteristics, and tissue miRNA expression. A, Boxplot of percentage of tumor field (tumor stroma plus tumor cells) per biopsy. Tumor field percentage was 30%‐100% with a median of 100% and an average of 86%. B, numbers and location of the different biopsies included in the tissue cohort. C, Unsupervised cluster analysis of log2, normalized to miR‐16‐5p, tissue miRNA expression levels. prim. tumor loc.: primary tumor location; norm.: normalized to miR‐16‐5p
