
FIGURE 5.
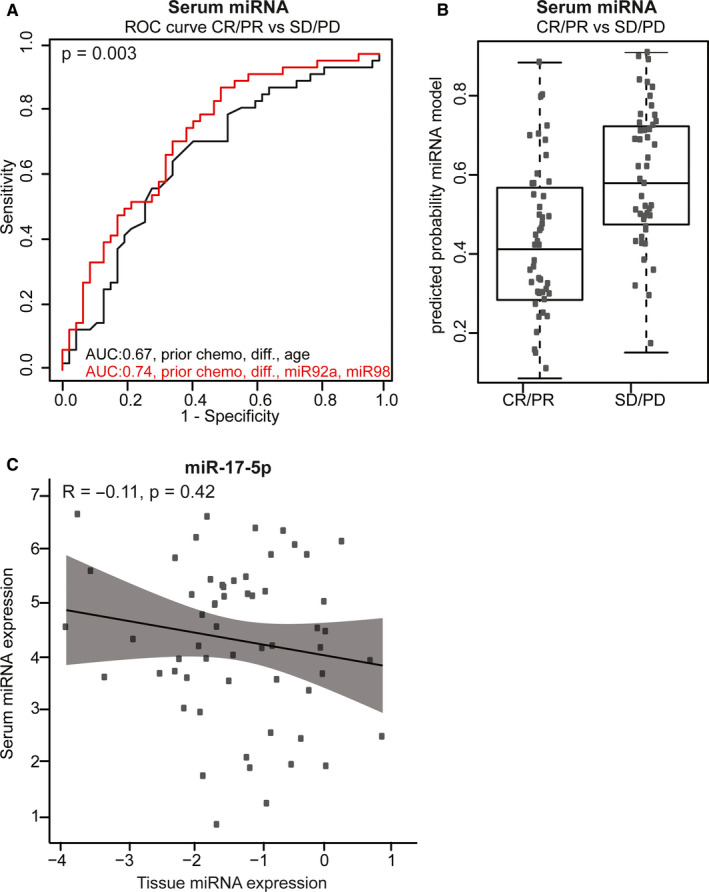
Performance of the predictive models in the serum cohort. A, ROC curve analysis for prediction of CR/PR (n = 46) vs SD/PD (n = 47) after three to four cycles of chemotherapy in the serum cohort. Black line: the model with the clinicopathological factors: age, differentiation and prior use of chemotherapy. Red line: the final model after backward selection using the clinicopathological factors combined with expression levels of miR‐92a‐3p and miR‐98‐5p. B, Individual predicted probabilities of the model with miRNAs presented with the red line in (A) for CR/PR vs SD/PD after three to four cycles of chemotherapy (prior chemo, differentiation, miR‐92a‐3p and miR‐98‐5p). Median predicted probability for CR/PR and SD/PD was 0.42 and 0.59, respectively. C, Correlation plot of log2 normalized tissue miRNA expression levels (x‐axis) and log2 normalized serum miRNA expression levels (y‐axis). Data are presented for miR‐17‐5p only, similar results were observed for other miRNAs (data not shown). AUC, area under the curve; CR, complete response; diff., differentiation; PD, progressive disease; PR, partial response; ROC, receiver operator characteristics; SD, stable disease.