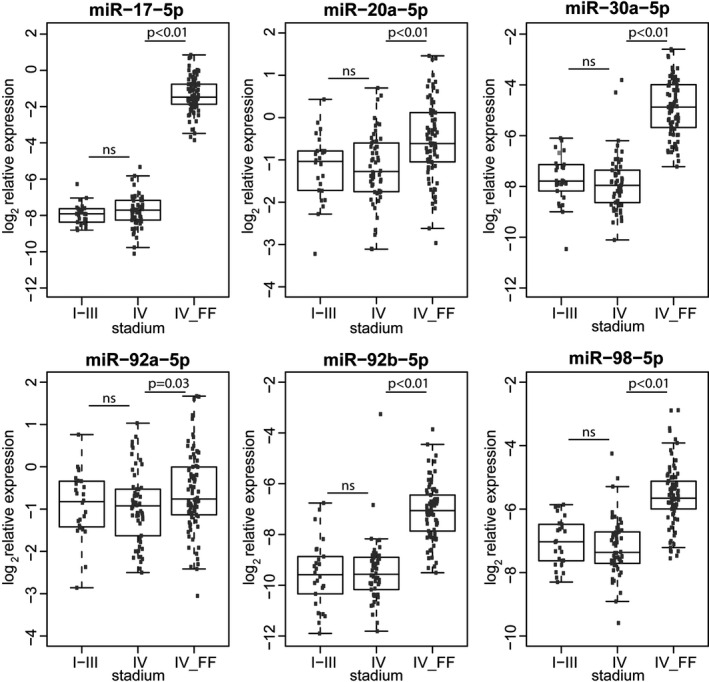
FIGURE 6.

miRNA expression in the original FFPE cohort compared to the fresh frozen cohort. The original FFPE cohort was divided in stage I‐III and IV. The cohort consisted only of patients with stage IV disease (IV_FF). Differences in expression were compared between stadium I‐III (n = 26) and IV (n = 54) from the original FFPE cohort, and between stadium IV (n = 54) from the original FFPE cohort and IV_FF (n = 81) from the fresh frozen cohort using a two‐tailed unpaired t test. Log2 expression levels are presented as average from duplicate measurements relative to miR‐16‐5p. miRNA data were adapted from Neerincx et al. 15 NS: not significant. FF, fresh frozen; FFPE, formalin‐fixed paraffin‐embedded; IV_FF, stadium IV fresh frozen cohort
