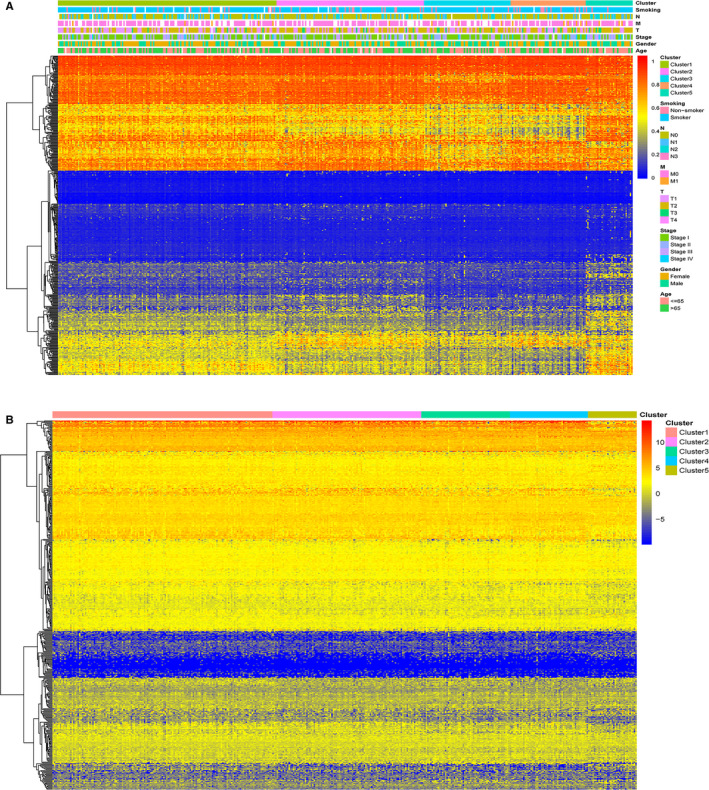
FIGURE 3.

Heat maps showing methylation and corresponding gene expression profile of the 436 CpG sites. A, Heat map illustrating the methylation of each cluster. The blank in the annotation bar refers to not available (NA) clinical traits. B, Heat map displaying the expression profile of the 484 annotated genes. The gene expression of cluster 5 differed slightly from those of other clusters. The expression data of the annotated genes were log2 transformed
