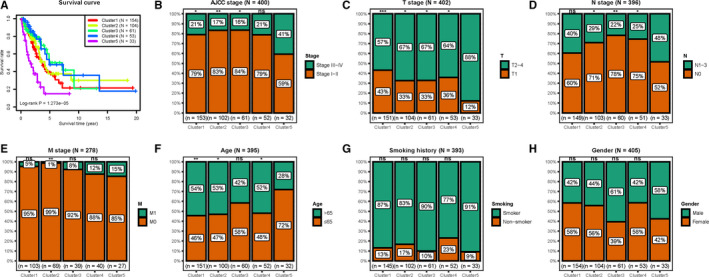
FIGURE 4.

Analyses of the survival and clinical features of the five clusters. A, Survival curves comparing different clusters (log‐rank P = 1.273e‐05). B‐H, The distribution proportions of (B) AJCC stage, (C) T stage, (D) N stage, (E) M stage, (F) age, (G) smoking history, and (H) gender in each cluster. Chi‐square test was performed to assess the statistical significance of differences in clinicopathological distribution between patients in cluster 5 and other clusters. ns, not significant; *P < .05; **P < .01; ***P < .001
