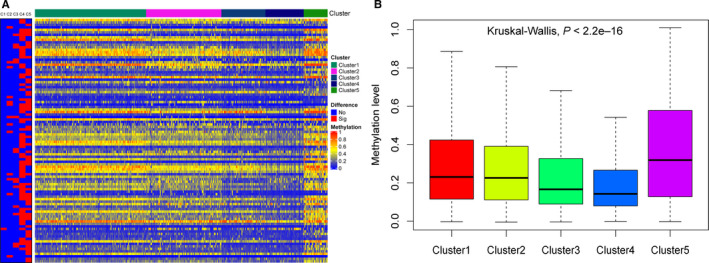
FIGURE 5.

Cluster‐specific CpGs of each cluster. A, Heat map showing the expression of cluster‐specific CpG sites. The red block in the left panel represents the specific CpGs for clusters 1‐5 from left to right. C1, Cluster 1; C2, Cluster 2; C3, Cluster 3; C4, Cluster 4; and C5, Cluster 5. B, Box plot showing that cluster 5 had the highest methylation level among the five groups
