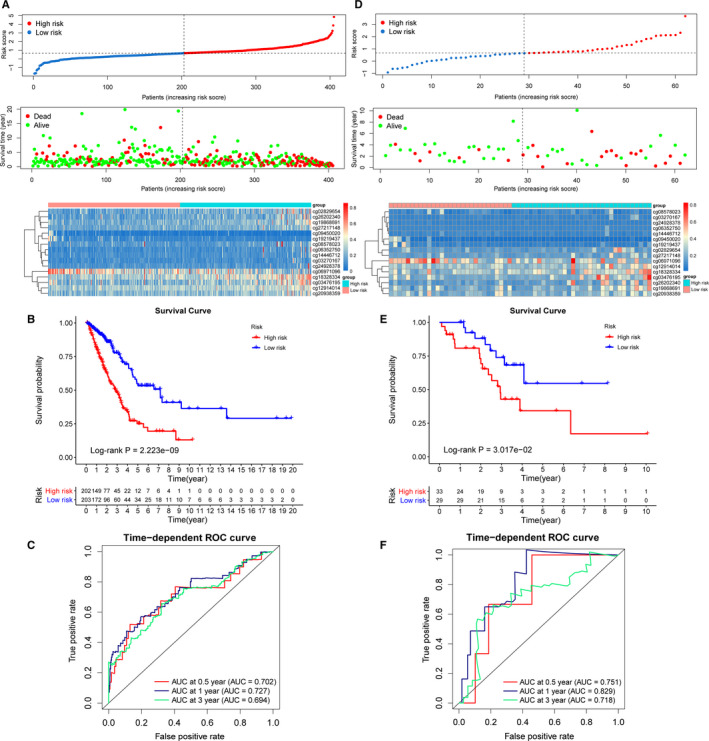
FIGURE 6.

Construction of prognostic prediction model and model validation. A, Risk score (top), overall survival (middle) of patients, and CpG methylation (bottom) in the training set. B, Survival curves showing that the prognostic model clearly distinguished patients in high‐risk and low‐risk groups (log‐rank P = 2.223e‐09). C, Time‐dependent ROC curves for patients with LUAD in the training set. The AUC in 0.5, 1, and 3 y were 0.702, 0.727, and 0.694, respectively. D, Risk score (top), overall survival (OS) (middle) of patients, and CpG methylation (bottom) in the test set. E, Survival curves showing that the prognostic model clearly distinguished patients in high‐risk and low‐risk groups (log‐rank P = 3.017e‐02). F, Time‐dependent ROC curves for patients with LUAD in the test set. The AUC in 0.5, 1, and 3 y were 0.751, 0.829, and 0.718, respectively
