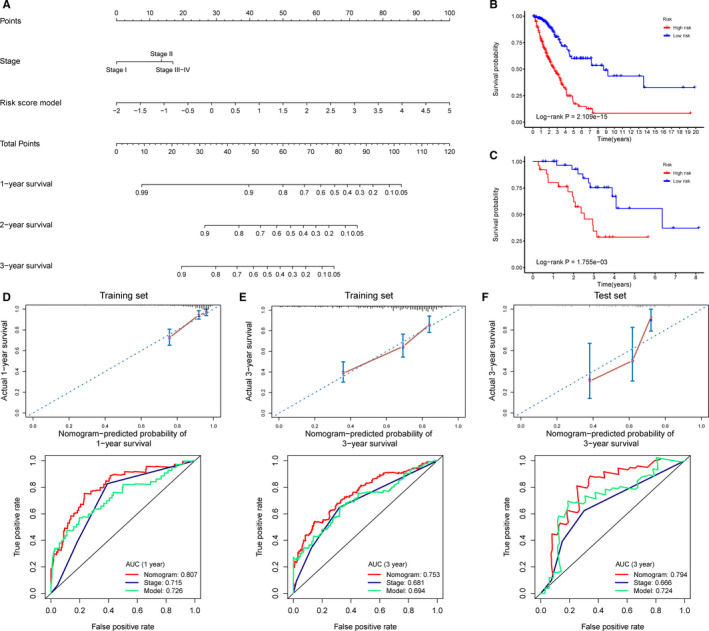
FIGURE 9.

Nomogram development and evaluation. A, A nomogram to predict OS of patients with LUAD. B‐C, Kaplan‐Meier survival analysis for patients in the training set and the test set according to the risk scores calculated from the nomogram. D‐E, Calibration curves and time‐dependent ROC curves at 1 and 3 y for patients in the training set. F, Calibration curves and time‐dependent ROC curves at 3 y for patients in the test set. ROC plots in D‐F compare AUC values of the nomogram, AJCC stage, and the risk score model. The AUC values of the risk score model and the X‐axis range in C differ slightly from those in Figure 6 because of the removal of samples with missing AJCC stage data
