
Figure 3.
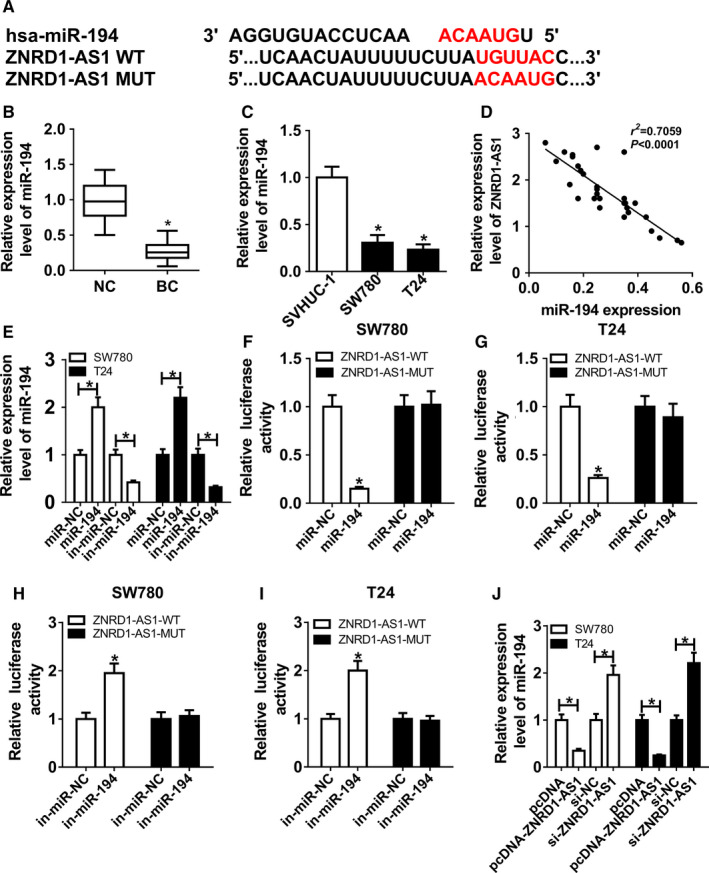
miR‐194 was bound to ZNRD1‐AS1. (A) The putative binding sites of ZNRD1‐AS1 and miR‐194 were predicted by DIANA tools. (B and C) The expression of miR‐194 was measured in BC tissues and cells by qRT‐PCR. (D) The correlation between the expressions of ZNRD1‐AS1 and miR‐194 in BC tissues was analyzed by Spearman rank correlation. (E) The abundance of miR‐194 was detected in SW780 and T24 cells transfected with miR‐194, miR‐NC, in‐miR‐194, or in‐miR‐NC by qRT‐PCR. (F‐I) Luciferase activities were analyzed in SW780 and T24 cells co‐transfected with ZNRD1‐AS1‐WT or ZNRD1‐AS1‐MUT and miR‐194, miR‐NC, in‐miR‐194 or in‐miR‐NC. (J) The expression of miR‐194 was measured in SW780 and T24 cells transfected with pcDNA, pcDNA‐ZNRD1‐AS1, si‐NC, or si‐ZNRD1‐AS1 by qRT‐PCR. *P < .05