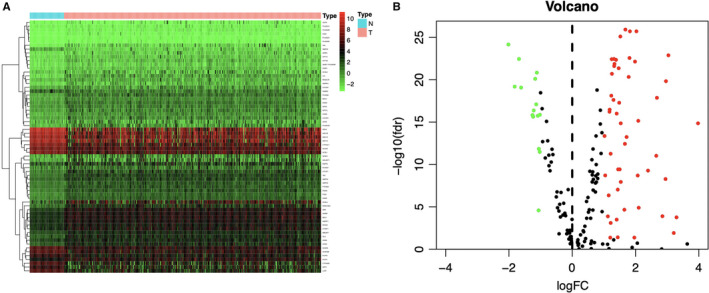
FIGURE 1.

Differentially expressed lipid metabolism‐related genes in The Cancer Genome Atlas hepatocellular carcinoma (HCC) patients. Heatmap (A) and volcano plot (B) demonstrate differentially expressed lipid metabolism‐related genes between HCC and non‐tumor tissues. In terms of the heatmap, the colors from green to red represent low to high gene expression levels. In the volcano plot, red dots represent differentially upregulated expressed genes, green dots represent differentially downregulated expressed genes, and black dots represent no differentially expressed genes. N, normal tissue. T, tumor
