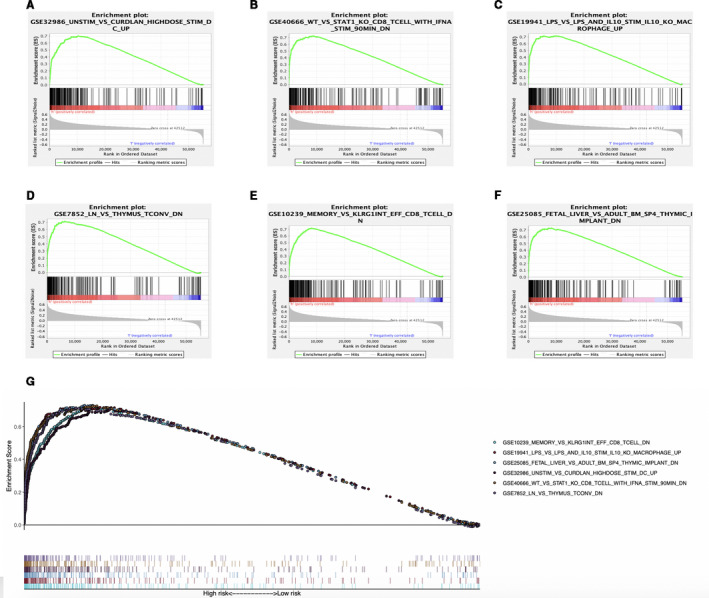
FIGURE 11.

Enrichment plots of immune‐related gene sets from gene set enrichment analysis (GSEA). GSEA results showing gene sets in (A) GSE32986, (B) GSE40666, (C) GSE19941, (D) GSE7852, (E) GSE10239, and (F) GSE25085 are differentially enriched in high‐risk phenotype. G, Summarizes the above six gene sets
