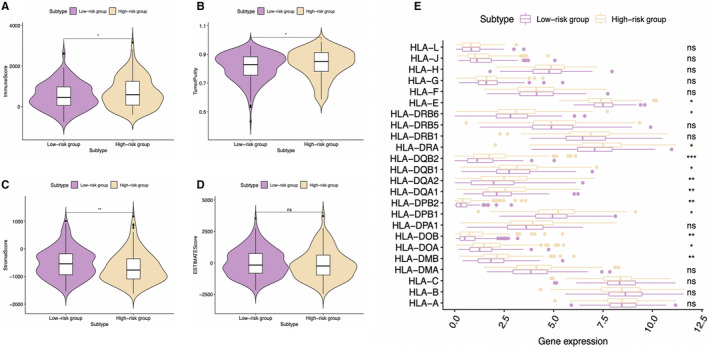
FIGURE 12.

Analysis of different immune status in high‐ and low‐risk groups of The Cancer Genome Atlas hepatocellular carcinoma cohort. A, Comparison of (A) immune score, (B) tumor purity, (C) stromal score, and (D) ESTIMATE score between high‐ and low‐risk groups is shown. E, Comparison of the expression levels of human leukocyte antigen (HLA) genes between high‐ and low‐risk groups
