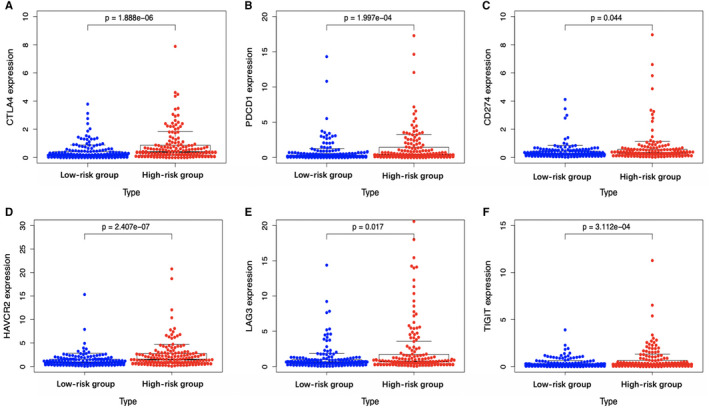
FIGURE 13.

Scatter plots visualizing significantly different immune checkpoints between high‐risk and low‐risk cases. CTLA‐4, cytotoxic T‐lymphocyte associated protein 4; LAG3, lymphocyte activation gene‐3; PD‐1, programmed cell death 1; TIGIT, T‐cell immunoreceptor with Ig and ITIM domains
