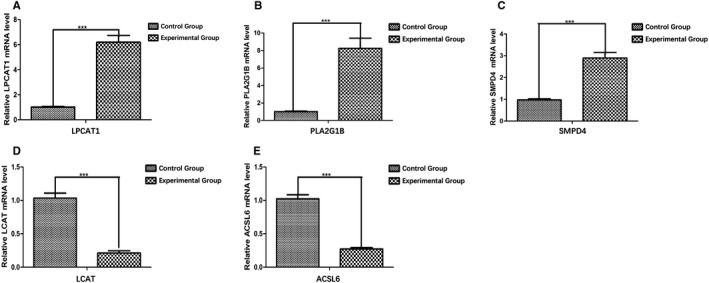
FIGURE 14.

The quantitative real‐time polymerase chain reaction (qRT‐PCR) validation of five genes included in the prognostic model. A, LPCAT1, (B) PLA2G1B, and (C) SMPD4 were significantly overexpressed in the experimental group (hepatocellular carcinoma tissues) compared with the control group (para‐carcinoma tissues). The expression of (D) LCAT and (E) ACSL6 was significantly lower in the experimental group (hepatocellular carcinoma tissues) compared with the control group (para‐carcinoma tissues). *P < .05; **P < .01; ***P < .001
