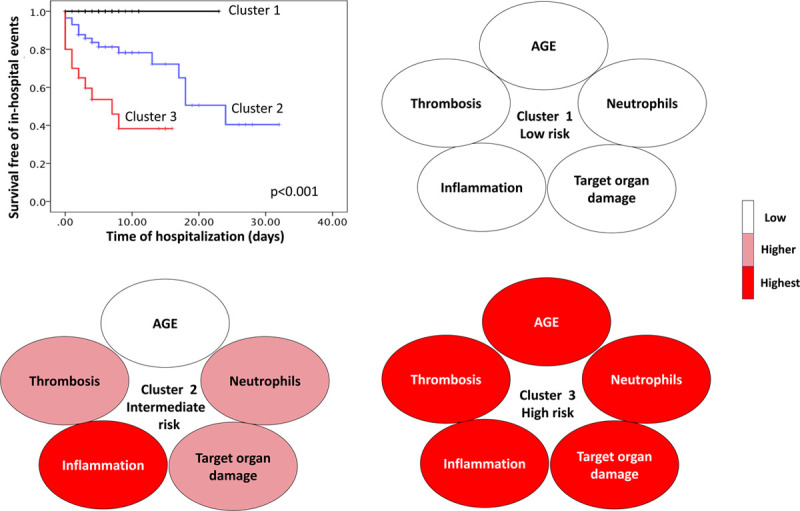
Figure 2.

Unsupervised computational cluster model. The model was initiated after feature extraction using best predictors of in-hospital outcomes from Cox regression model and receiver operator characteristic curve, namely age, initial and follow-up d-dimer above 461 and 491 ng/mL, respectively, and initial and follow-up lactate dehydrogenase 467 505 units/L, respectively. The model output showed 3 clusters. Based on Kaplan-Meier curve (upper left), cluster 1 was a low-risk cluster with zero outcomes (black line), cluster 2 was intermediate risk (blue line), and cluster 3 was high risk (red line). Post hoc analysis for cluster description based on domains of age, thrombosis, inflammatory cells, inflammatory markers, and target organ damage showed a progressively worsening profile from clusters 1 to 3.
