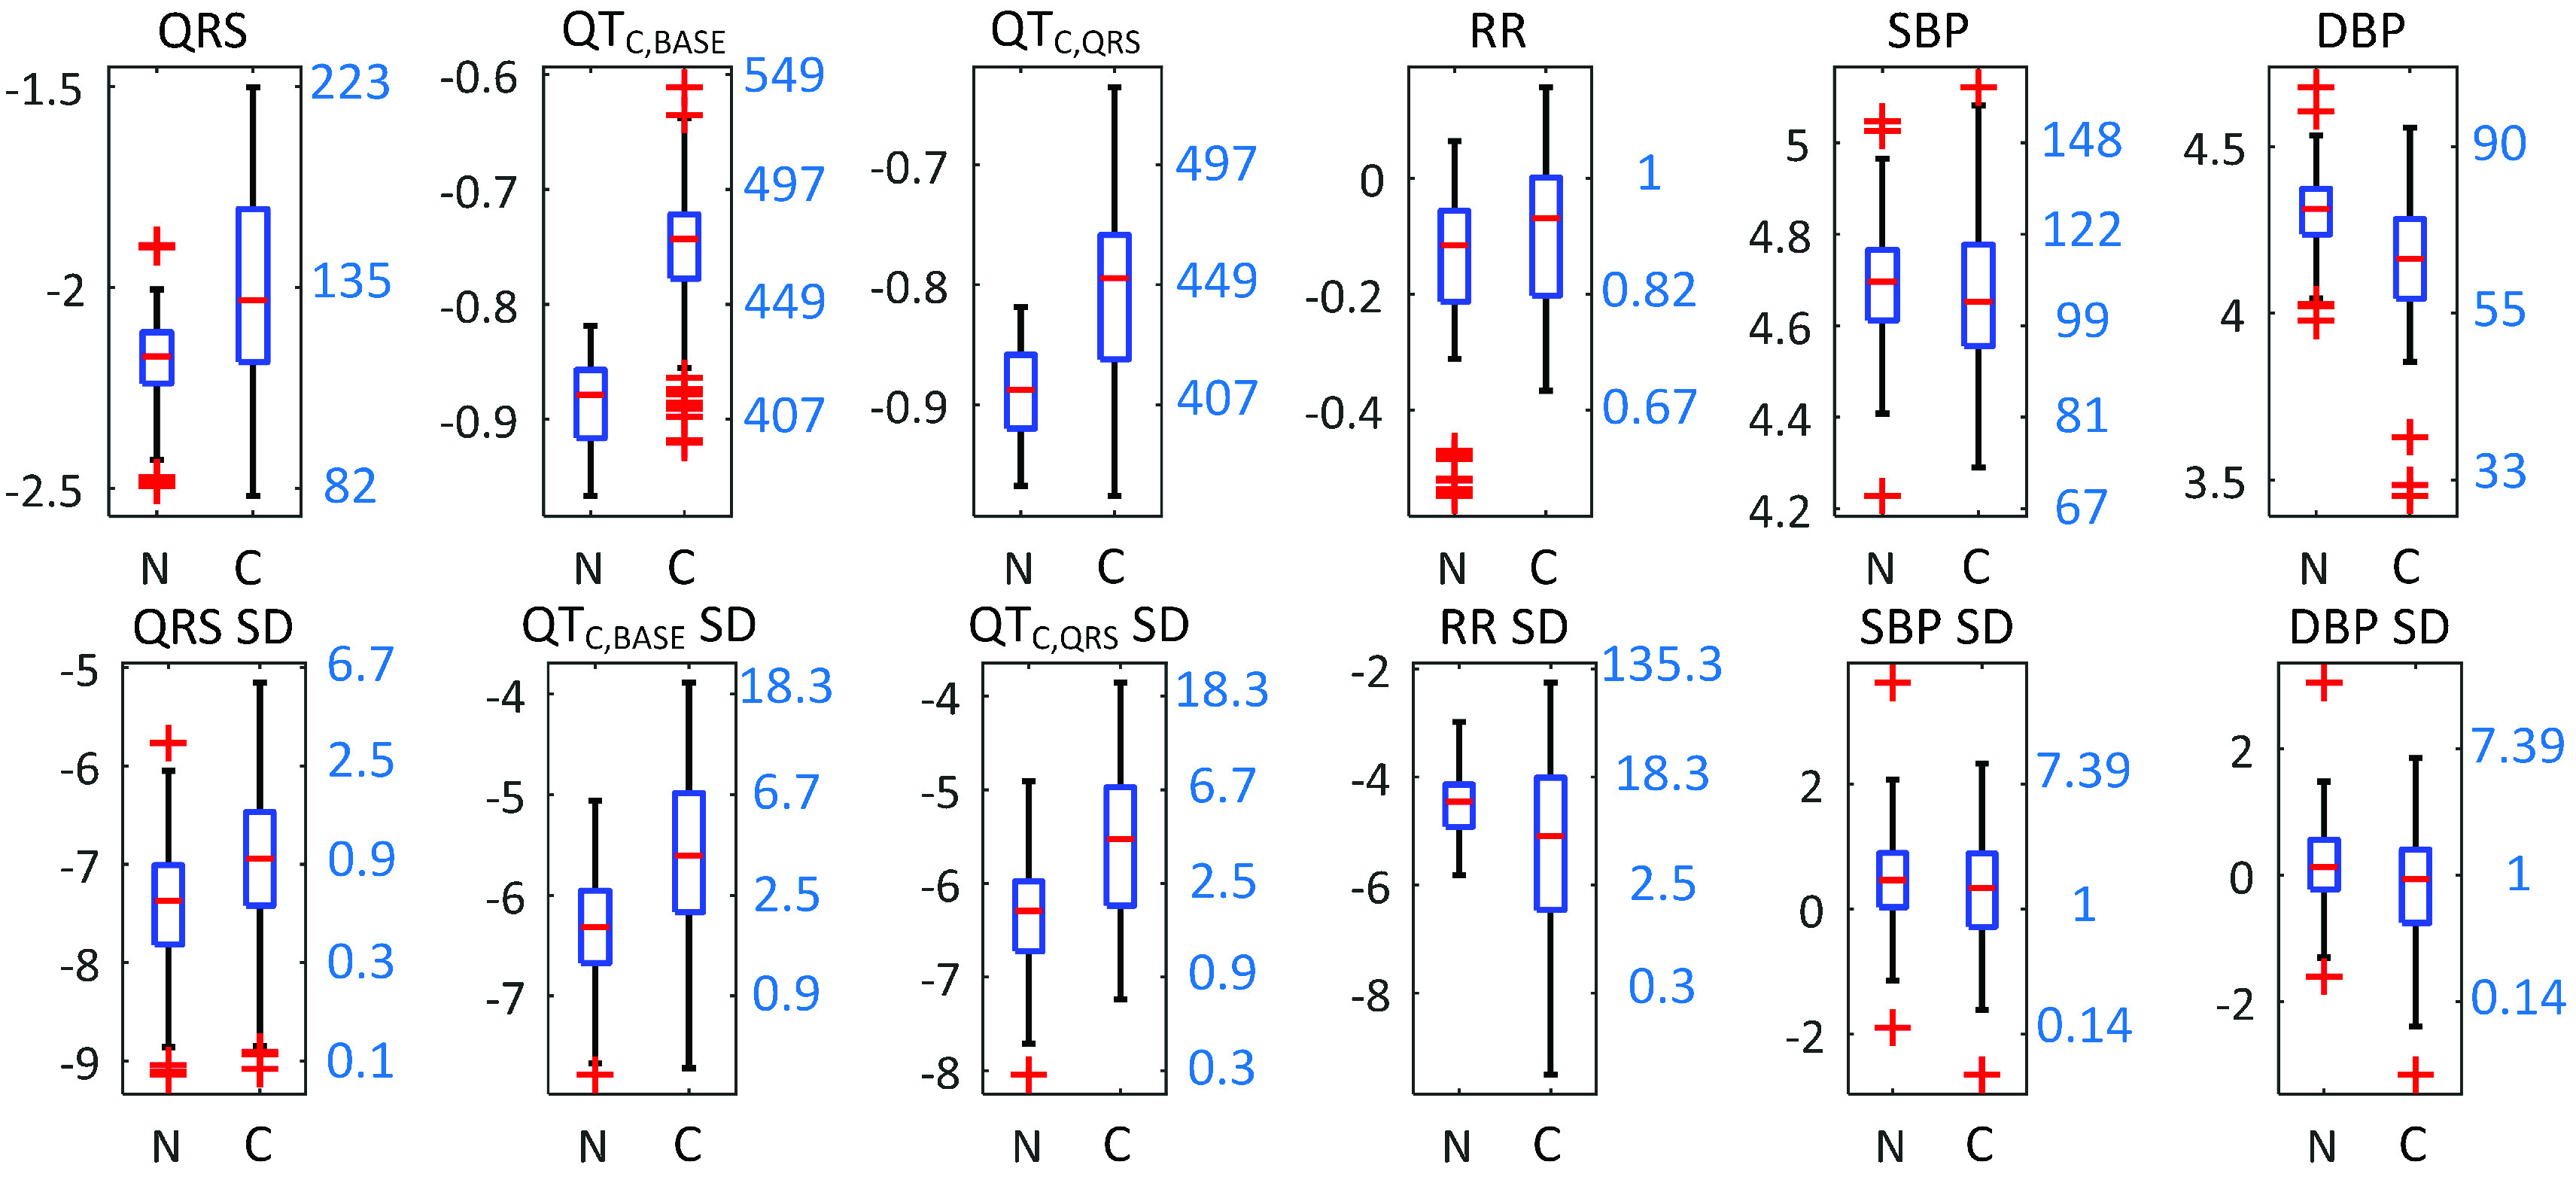
FIGURE 10.

Box plots of other reference parameters comparing the non-clinical and clinical populations. Left y-axis shows the logarithmic scale and the right y-axis shows the converted numbers translated from the log scale. Units of translated y-axes are the following. QRS, QT , QT
, QT : ms; RR: s; SBP, DBP: mmHg.
