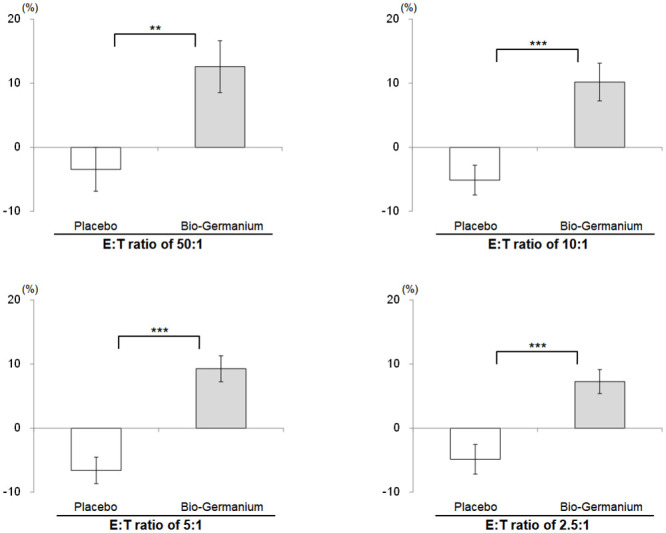
Fig 2. Comparison of NK cell cytotoxicity Δ values before and after supplementation.

The data represent the mean ± standard error. Δ represents the change from baseline at follow-up. **P<0.01 and ***P<0.001 values were derived from adjusted baseline ANCOVA for Δ between groups.
