Figure 4.

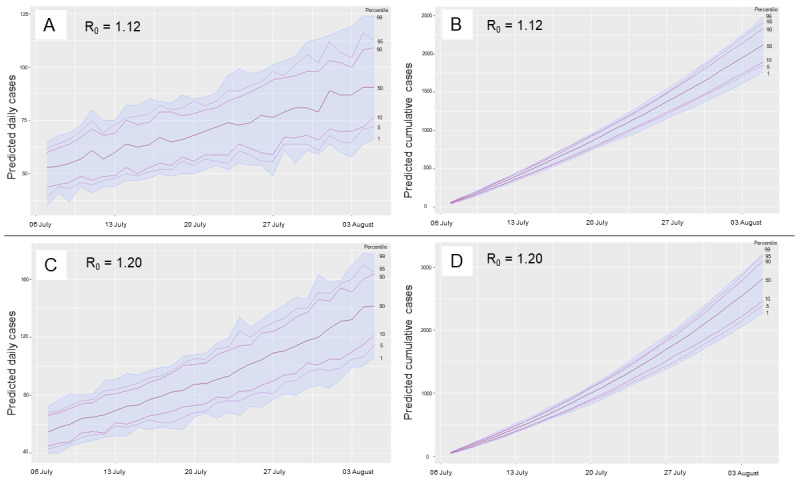
Projections of daily and cumulative COVID-19 caseloads over the next 30 days using the instantaneous R0 value of 1.12 on July 6, 2020 (A-B) and the overall R0 value of 1.20 for the most recent 30 days (C-D).

Projections of daily and cumulative COVID-19 caseloads over the next 30 days using the instantaneous R0 value of 1.12 on July 6, 2020 (A-B) and the overall R0 value of 1.20 for the most recent 30 days (C-D).