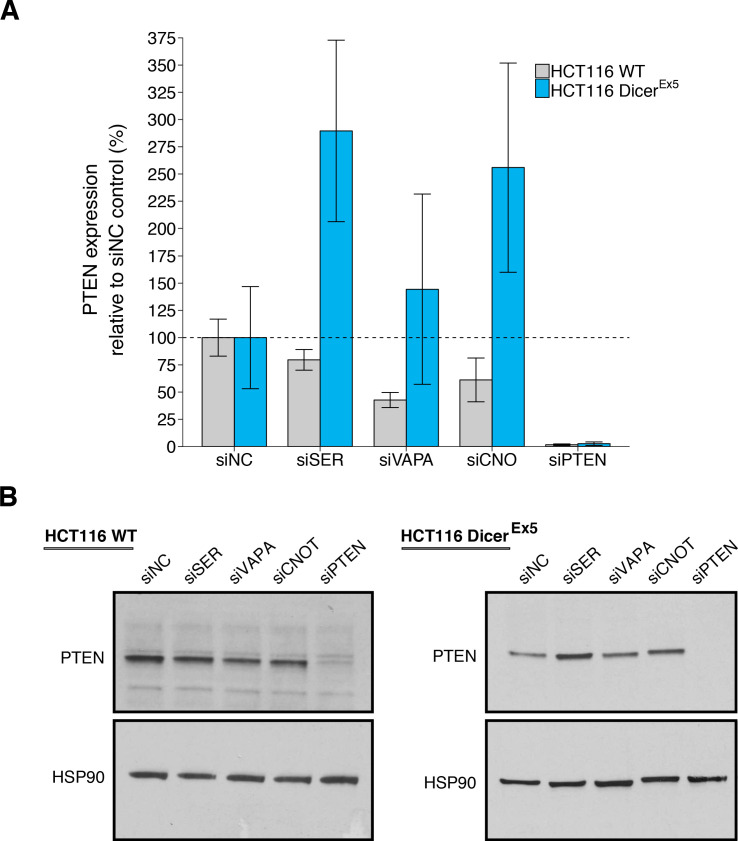
Figure 3. PTEN protein expression in wild-type and DICER mutant HCT116 cells depleted of PTEN ceRNAs.
Wild-type (WT) and DICER mutant (DicerEx5) HCT116 cells were transfected with non-targeting control siRNA (siNC) or siRNA plasmids targeting SERINC1 (siSER), VAPA (siVAPA), CNOT6L (siCNO), or PTEN (siPTEN). Cells were harvested 72 hr later for Western blot analysis. (A) Relative protein expression (PTEN/HSP90) are presented for each condition. Western blot bands were quantified, PTEN levels were normalized to HSP90, with protein expression presented relative to siNC. Means reported and error bars represent SD from three independent biological repeats for wild-type HCT116 cells and four repeats for DicerEx5 HCT116 cells. Analysis of wild-type HCT116 cells: one-way ANOVA (equal variance) on PTEN/HSP90 expression: F(4,10) = 25.4, I=3.18×10⁻⁵. Planned contrasts between siNC and siSER: t(10) = 1.94, uncorrected I=0.082 with a priori Bonferroni adjusted significance threshold of 0.0125, Bonferroni corrected p=0.326; siNC and siVAPA: t(10) = 5.44, uncorrected p=2.85×10⁻⁴, Bonferroni corrected p=0.0011; siNC and siCNOT: t(10) = 3.69, uncorrected p=0.0042, Bonferroni corrected p=0.017; siNC and siPTEN: t(10) = 9.34, uncorrected p=2.97×10⁻⁶, Bonferroni corrected p=1.19×10⁻⁵. Analysis of DicerEx5 HCT116 cells: one-way ANOVA (unequal variance) on PTEN/HSP90 expression: F(4,6.0) = 19.3, p=0.0014. Planned comparisons: siNC and siSER: two-sample t-test, t(6) = 3.96, uncorrected p=0.0074 with a priori Bonferroni adjusted significance threshold of 0.0125, Bonferroni corrected p=0.030; siNC and siVAPA: two-sample t-test, t(6) = 0.896, uncorrected p=0.405, Bonferroni corrected p>0.99; siNC and siCNOT: Welch’s t-test, t(4.36) = 2.92, uncorrected p=0.039, Bonferroni corrected p=0.156; siNC and siPTEN: two-sample t-test, t(6) = 4.15, uncorrected p=0.0060, Bonferroni corrected p=0.024. (B) Representative Western blots probed with an anti-PTEN antibody and anti-HSP90 antibody. Additional details for this experiment can be found at https://osf.io/drcbw/.


