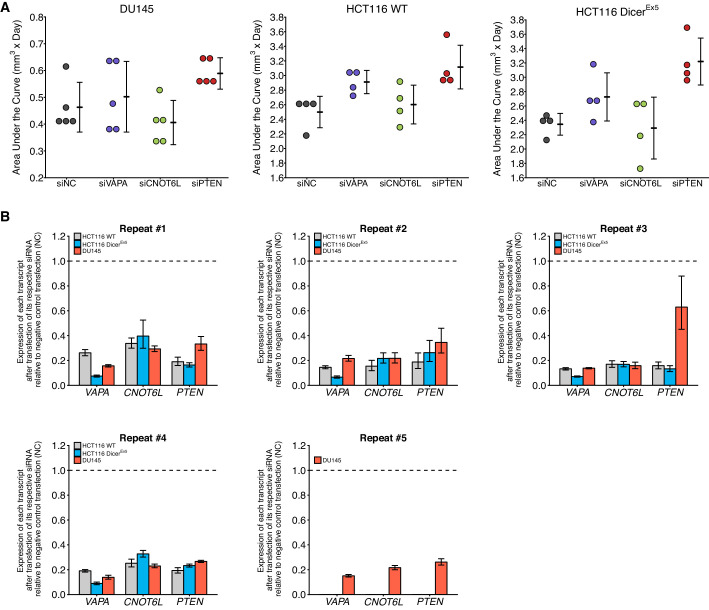
Figure 4. Growth of cells depleted of PTEN ceRNAs.
DU145, wild-type (WT) and DICER mutant (DicerEx5) HCT116 cells were transfected with either a non-targeting control siRNA (siNC) or siRNA plasmids targeting VAPA (siVAPA), CNOT6L (siCNO), or PTEN (siPTEN). Crystal violet proliferation assays were performed each day as indicated starting the day after transfection. Relative OD590 was calculated relative to the average Day 0 values for each condition. Means reported and error bars represent SD from five independent biological repeats for DU145 cells and four times for HCT116 WT and DicerEx5 cells. Analysis on the area under the curve (AUC) for each condition of each biological repeat (reported as dot plot in Figure 4—figure supplement 1A). Analysis results for DU145 cells: one-way ANOVA (equal variance): F(3,16) = 3.27, p=0.049. Planned contrasts between siNC and siVAPA: t(16) = 0.648, uncorrected p=0.526 with a priori Bonferroni adjusted significance threshold of 0.0167, Bonferroni corrected p>0.99; siNC and siCNOT6L: t(16) = 0.950, uncorrected p=0.356, Bonferroni corrected p>0.99; siNC and siPTEN: t(16) = 2.09, uncorrected p=0.053, Bonferroni corrected p=0.158. Analysis of HCT116 cells: two-way ANOVA interaction between DICER status (wild-type or Ex5) and siRNA target: F(3,24) = 0.734, p=0.542; main effect of DICER status: F(1,24) = 1.81, p=0.191; main effect of siRNA target: F(3,24) = 12.1, p=5.20×10⁻⁵. Planned contrasts in HCT116 WT cells: siNC and siVAPA: t(24) = 2.02, uncorrected p=0.054 with a priori Bonferroni adjusted significance threshold of 0.0083, Bonferroni corrected p=0.325; siNC and siCNOT6L: t(24) = 0.506, uncorrected p=0.618, Bonferroni corrected p>0.99; siNC and siPTEN: t(24) = 3.03, uncorrected p=0.0057, Bonferroni corrected p=0.034. Planned contrasts in HCT116 DICEREx5 cells: siPTEN and siVAPA: t(24) = 2.43, uncorrected p=0.023, Bonferroni corrected p=0.138; siPTEN and siCNOT6L: t(24) = 4.57, uncorrected p=1.25×10⁻⁴, Bonferroni corrected p=7.48×10⁻⁴; siNC and siPTEN: t(24) = 4.31, uncorrected p=2.42×10⁻⁴, Bonferroni corrected p=0.0015. Additional details for this experiment can be found at https://osf.io/5c7sb/.


