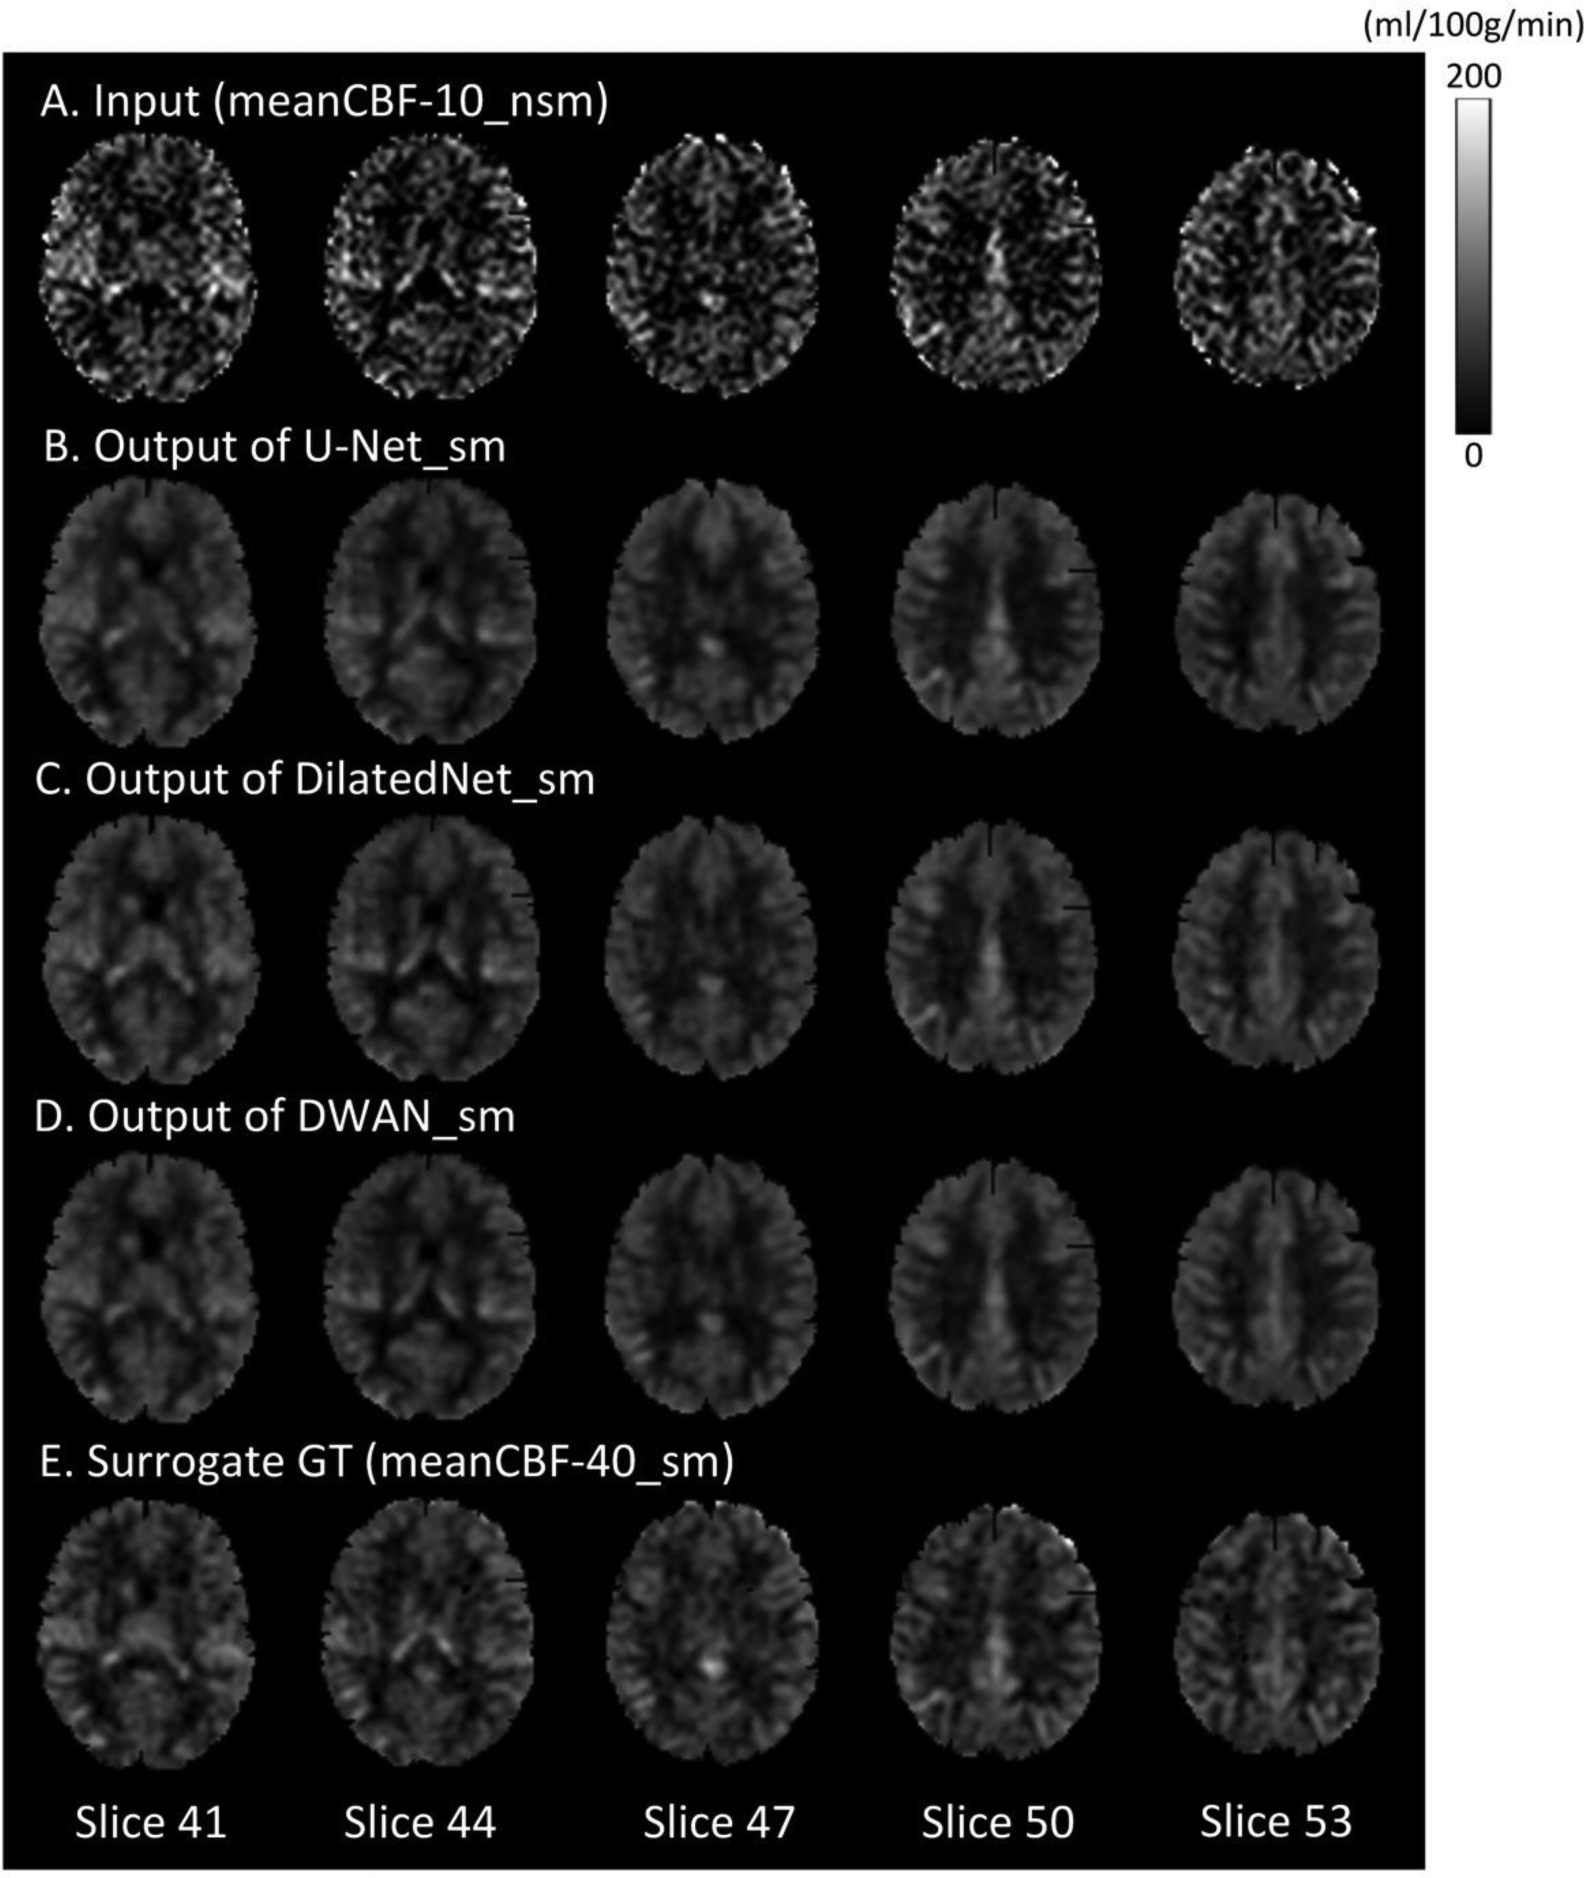
Figure 2.

Mean CBF images (only 5 axial slices were shown) from a representative subject with different processing methods. From top to bottom: meanCBF-10_nsm as input, the output of U-Net_sm, the output of DilatedNet_sm, the output of proposed DWAN_sm and the surrogate GT (meanCBF-40_sm) as training reference.
