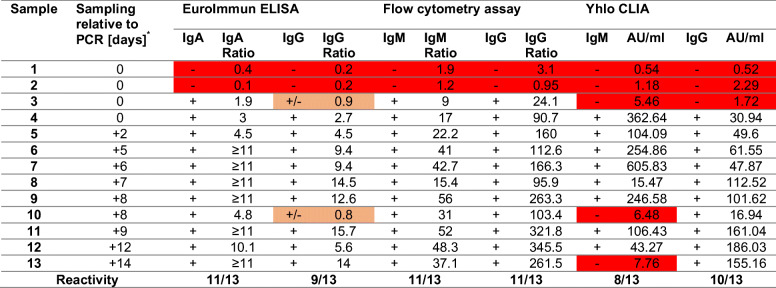
Table 3.
Analysis of serum samples from COVID-19-infected individuals at various time points relative to PCR-confirmation by EuroImmun ELISA, in-house flow cytometric assay, and Yhlo CLIA
* Time gap between SARS-CoV-2 diagnosis by PCR and collection of blood sample. AU, arbitrary units. +, seropositive. -, seronegative. +/-, borderline. Ratios for IgG and IgA ELISA indicate the ratio between sample and calibrator. Ratios for the flow cytometric assay indicate the ratio MFI (SARS-CoV-2)/MFI (Mock) for a given sample. Red/orange background indicates negative/borderline result

