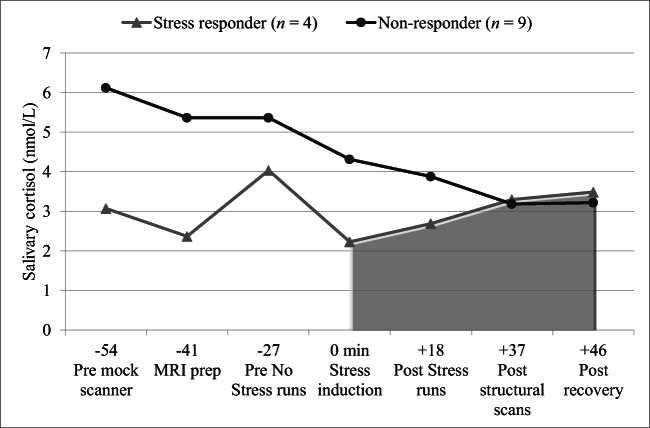
Fig. 2.
Time course of salivary cortisol levels in stress responders and non-responders pre and post stress induction. Time zero indicates the cortisol sample immediately before experimental stress induction. Cortisol peaks 20–40 min post stressor. Practice in the mock scanner elicited reactivity in some participants. Therefore, area under the curve with respect to increase (AUCI) was calculated using the last four samples

