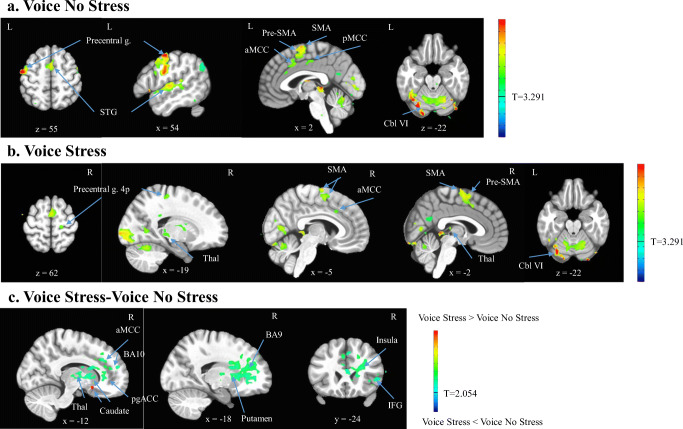
Fig. 4.
BOLD activation maps for the conditions (a). Voice No Stress (VoiceNS) minus rest, (b). Voice Stress (VoiceS) minus rest, and the contrast (c). VoiceS minus VoiceNS over rest. The t statistical parametric maps were thresholded at p = .001 (VoiceNS and VoiceS) and p = .04 (contrast VoiceNS vs. VoiceS) to achieve a family-wise error corrected p < .05. The contrast showed stressor-induced activations (red) and deactivations (green) in the caudate and deactivations (green/blue) in the right perigenual anterior cingulate cortex (pgACC), anterior middle cingulate cortex (aMCC), inferior frontal gyrus (IFG), BA 9, BA 10, insula, putamen, and thalamus (Thal). Precentral g. = precentral gyrus, STG = superior temporal gyrus, SMA = supplementary motor area, Cbl VI = cerebellum lobule VI

