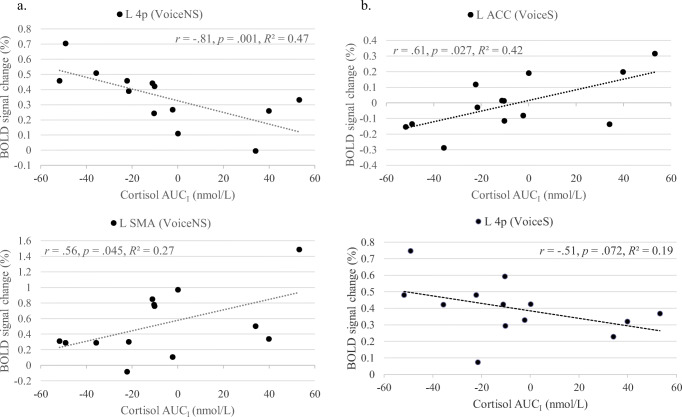
Fig. 7.
Correlations between the cortisol response to the stressor (area under the curve with respect to increase [AUCI in nmol/L]) and mean percent BOLD signal changes during the conditions (a). Voice No Stress (VoiceNS) and (b). Voice Stress (VoiceS) in the left (L) area 4p, L supplementary motor area (SMA), and L anterior cingulate cortex (ACC)

