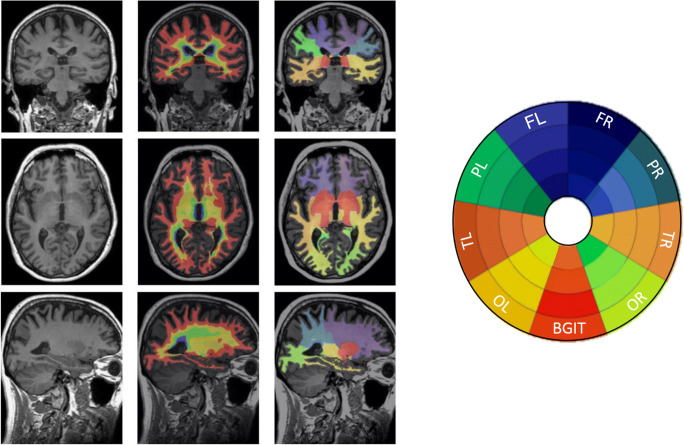
Fig. 1.
Example of the segmentation of one participant and the Bullseyes plot representation. On the left figure, the left column, T1w MR image from one participant is presented in the three views: coronal, axial and sagittal (from up to bottom). In the central and right columns, the same views are shown with the layer and lobar segmentations overlaid, respectively. Abbreviations: FR, frontal right; FL, frontal left; TR, temporal right; TL: temporal left; PR, parietal right; PL, parietal left; OR, occipital right; OL, occipital left and BG, basal ganglia

